Territory Organization on Areas
In this workbook we show you how easy it is to create a territory structure with locations based on postal codes. In addition, all territory analyses are presented and an attractive export sheet is generated.
The workbook contains the following sheets:
Planning at area level
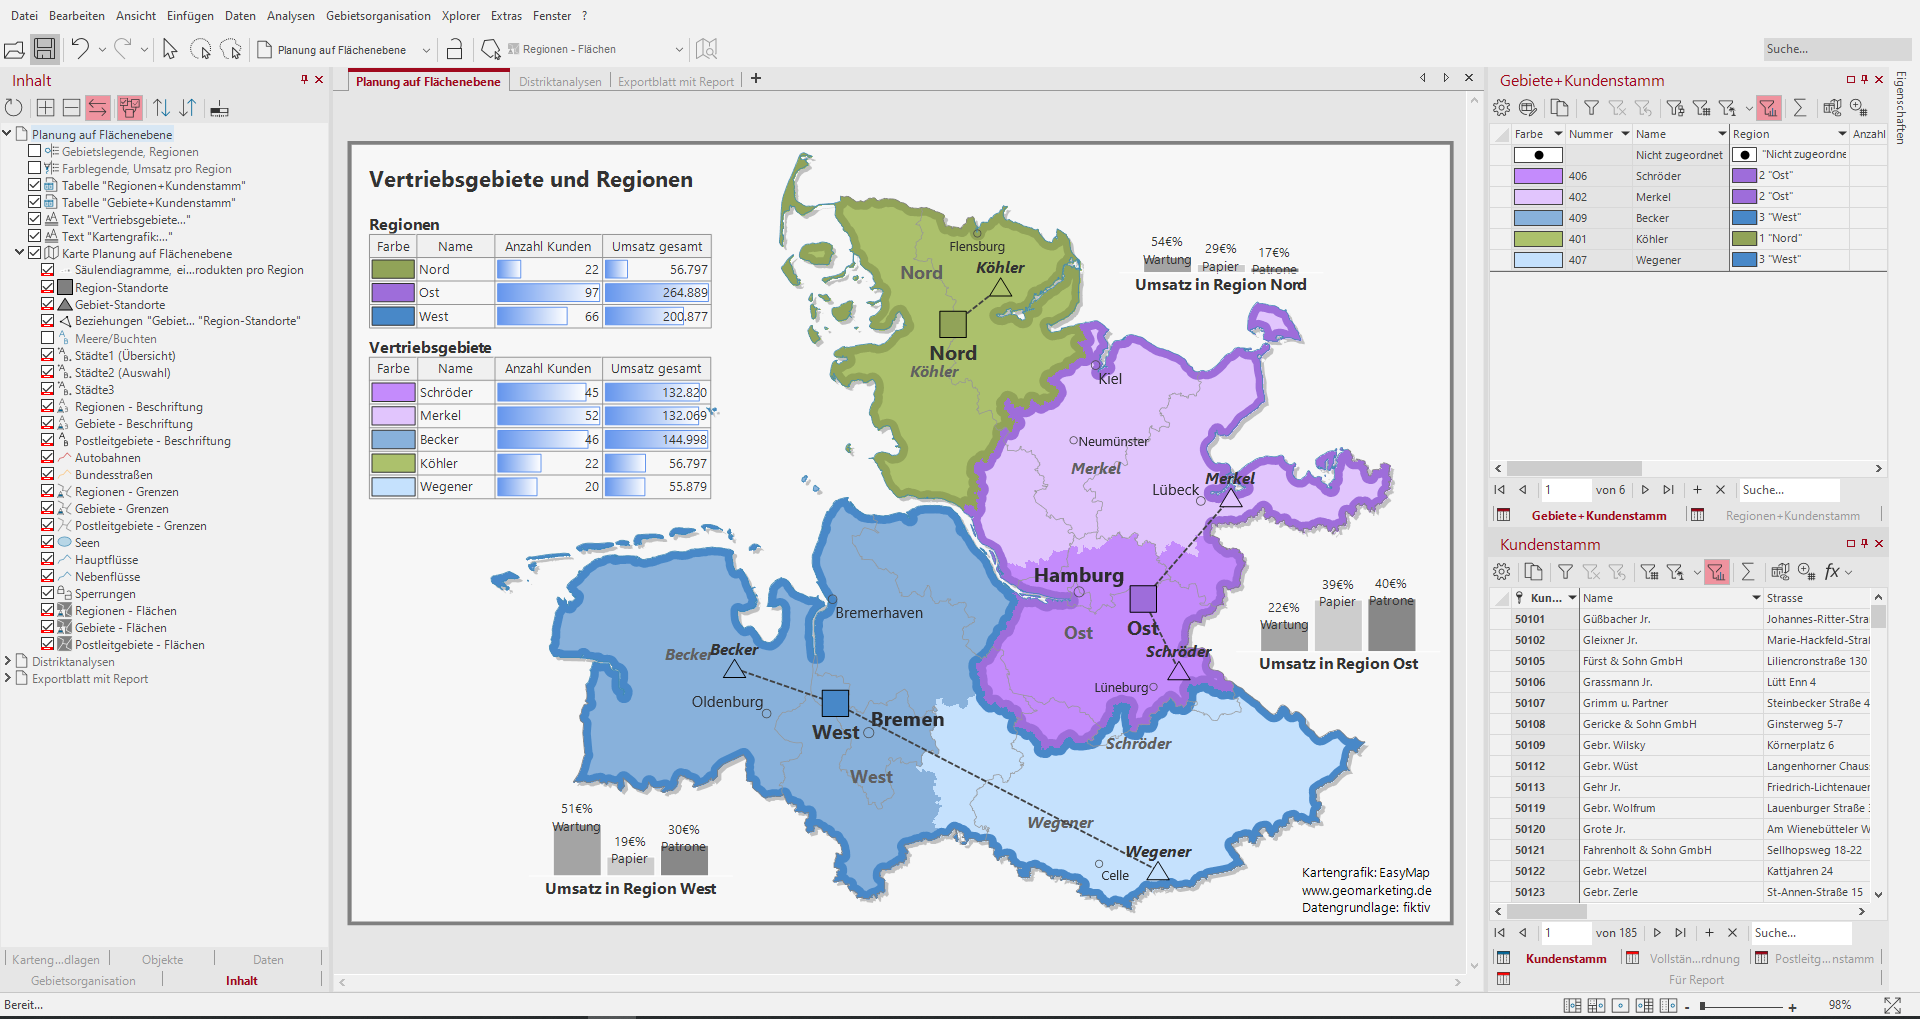
On this sheet, you can see a two-stage territory structure with Territories and Regions. The coloring of the Territories is set hierarchically to the superior Regions; so that a simple visual assignment of Territories to the Regions is possible. The Locations of the territories and regions have the same colors as the levels. Additionally, the locations have identified relationships to the Territory locations and Region locations while the Turnovers for Maintenance, Paper, and Cartridges per region are displayed using Bar Charts. The label representing each bar chart region stays below, while the percentage distribution stays above. The Color Legend above the Bar Charts serves to inform the product divisions. The Table Objects for the table "Territories+Customer Base" and "Regions+Customer Base" on the left side of the sheet provide further information on the individual Regions, such as the number of customers and the "Total Turnovers". Since the colors of the territories are in the table object, it can also be a replacement for a legend. Alternatively, you can make a Territory legend, Regions, visible in the Contents control window.
In the data window on the right-hand side, you can switch between the territory work tables "Territories+Customer Base" and "Regions+Customer Base" in the upper area. In the lower area you can switch between the imported table "Customer master", the query "Complete assignment" and the work table "Postal code areas+Customer master".
How you can recreate this map:
- Data for the territory structure (e.g. names of areas and allocations) on the basis of postal code areas.
- Planning Mode and create a Create new territory structure using the wizard.
- Create locationseach for the areas and regions in a separate step.
- In the Territory Organization control window, use the context menu of the territory sites to Show relationships territory sites to parent sites to create.
- To the Territory Work Table "Territories", aggregate the customer data of the Customer Master table via Query Edit.
- Selection of the analysis Column diagram for the Regions layer with the settings: Selection of the data column "sales paper", "sales cartridges" and "sales maintenance", with corresponding color design. Set the property Data labeling to "Value" for the labeling of the columns under Details. Mark the column diagrams in the map mark and place them outside the regions and align them align.
- Color Legend for the analysis column chart and set it as the heading over the individual diagrams.
- Table Object for the Territory Work Table "Territories+Customer Base" and make it appealing.
- Table Object for the District Work Table "Regions + Customer Base" and make it appealing.
- Area Legend for the regions.
- Text Box for heading and footnote.
The following tables were used:
- Customer Base
- Territories+Customers
- Regions+Customer Base
District analyses

On this sheet, the four different territory analyses are included: distance zones, catchment areas, key areas and provision based on the area level. For each analysis, a legend is visible in the Contents control window. In addition, the area locations are marked on the map with a gray house. The analyses are created via the Territory Organization control window in the context menu of the layers. For each territory analysis, a matching color legend and a histogram have always been created to illustrate the distribution across classes. Finally, a scale has been placed in the map to help you estimate the distances on the map.
The Content control window allows you to switch between district analyses by clicking the round radio buttons. The district analyses are part of a Mutual visibility group, so only one analysis is visible at a time. The legends, histogram, and headings change automatically as they are in a Simultaneous visibility group with the respective district analysis. The symbols for the locations of the customers can also be made visible on the map.
How you can recreate this map:
- Drag the level "Areas" and "Area locations" of the Territory structure from the control window Area organisation onto the map.
- Select the analysis shortest travel distance in the context menu of the area territory locations, the settings to data column (distance to location) and keep the colours, the value classes are set to customized (6 zones with 20km width). The distance is calculated by shortest travel distance by car. The calculation is based on data from OpenStreetMap and was published under ODbl 1.0. In the window Content a legend is automatically generated.
- Select analysis distance zones in the layer context menu area locations, column settings (distance to location) and maintain colors that are class user defined classified (7 zones 20 km wide).
- Select the analysis Catchment areas in the context menu of the level Territory locations, set the property Calculation with Territory comparability to Territory-related evaluation (percentage), set the data column to "Total sales", retain the color settings and the classes.
- Select the analysis key areas in the context menu of the level areas, set the property Calculation with comparability of territories to territory-related evaluation (percentage), set the data column to "Total sales", keep the settings of the color and the classes.
- Select the analysis Coverage level Starting from the Territory locations, set the property Calculation of Capacity to "50" and select Distance to location as column, keep colors and classes.
- Insert Color legend andHistogram for each territory analysis and Content the Headline adjust if necessary.
- Text Box for the heading for each analysis.
- Simultaneous visibility group for each analysis with the corresponding heading, the histogram and legend are already internally linked to the analysis.
- Alternating visibility group for the territory analyses, so that only one territory analysis with the explanations is visible at a time.
- Select the analysis symbols with the settings: Analysis first couple, select the column "Classification" and classify according to feature, determine symbol, color and size for the respective feature.
- Combined Legend for the analysis Insert symbols.
- Add scale for further designs.
- Group for the individual territory analyses and move one heading, one legend and one histogram each.
*The calculation is based on data from OpenStreetMap and published under ODbl 1.0.
The following tables were used:
- Customer Base
-
Postal Code Areas + Customer Base
Routing and accessibility

This sheet shows you the optimized version of the area structure. The old version of the territories was optimized under the criterion of the fastest travel time* - 60 minutes travel time. The locations of the territories are not optimized because it would result in a change of address of the employee. Around the district locations, an accessibility analysis was made according to linear distance based on the level of territories. Customers are shown as symbol analysis. The table objects show sales per optimized territory and sales within each isoline of the accessibility analysis.
In the control window Content Route Calculations based on location can also be found. If you hover the mouse over each route or look into the properties of each route, you can see the distance in kilometers and the duration of the route by Shortest Driving Distance by Car. Finally, a scale has been placed in the map so that you can better estimate the distances on the map.
In order to focus on the accessibility analyses and the route calculations, topographic layers are not used in this map. The Internet map in gray tones serves for better orientation in space.
How you can recreate this map:
- Drag the level "Areas" and "Area locations" of the Territory structure from the control window Area organisation onto the map.
- Selection of the analysis symbols with the "Customer master" table. In the settings everything remains empty. Determine icon, color and size.
- Selection of the analysis accessibility according to linear distance. In the table, set the radius to 50 kilometers. Set border color and fill.
- Selection of analysis Calculate route by shortest travel distance by car transport. Draw routes on the map from the area location to the customer.
- Table Object for the table queries "Sales per accessibility 50km" insert and make appealing.
- Text Box for the heading for the analysis.
- Web Map and Scale für weitere Ausgestaltungen einfügen.
- Group for the table objects, texts and route calculations.
*Based on data from OpenStreetMap - published under ODbl 1.0
The following tables were used:
- Customer Base
-
Optimized area locations
-
Optimized Territories+Customers
-
Spatial relationship (50km)
-
Sales per accessibility 50km
Export sheet with report
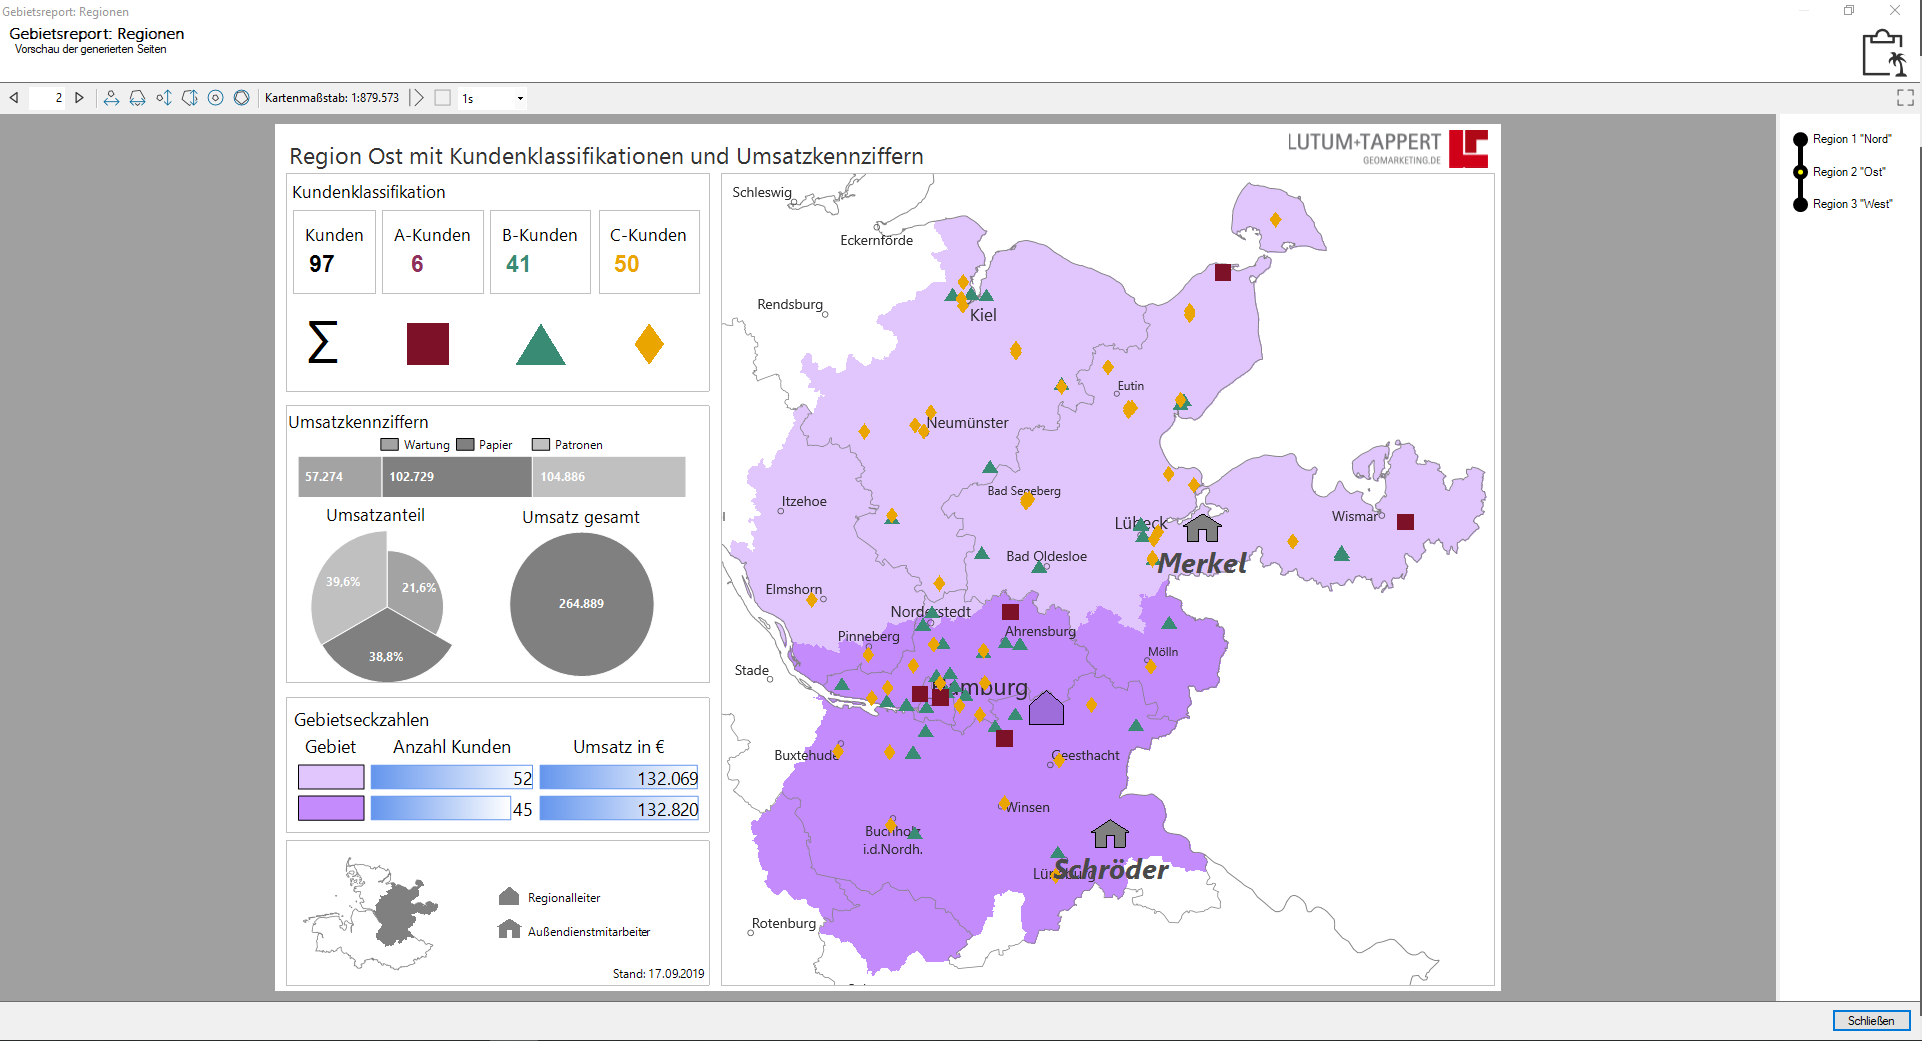
This sheet shows you an optimized display of a map with Report for exports to other formats, such as the easymap explorerimage files or office formats. To view the report, please click on Content with the right mouse button in the control window Area Report: Regions and select the command Show Report Preview from the context menu.
On the map, the Territories - Surfaces as well as the Territory Locations and Region Locations are visible. The customers are visualized as symbol analysis and classified according to the customer category A, B and C. Two circles with a radius of 20 and 40 km respectively can be seen starting from the Region locations and, if required, can be made visible in the Content control window.
On the left side, you will find other types of processed information. The Customer Classification block consists of Table objects, Graphic files, and Texts. The block turnover indicators consist of Individual charts and Legends. The key figures of the territory are in a Table Object. An Inset map, which highlights the section where the region is situated, you will find below. Graphic files and Texts serve to explain the locations.
How you can recreate this map:
- Drag the layers "Optimized territories", " Optimized regions" and both locations levels of the optimized territory structure from the Territory organization control window onto the map.
- Selection of analysis Symbols, setting: pair color, size and symbols, symbol via data column "Classification" with one color, shape and size each for the 3 characteristics. In the Content control window, a legend is automatically created.
- Report on regions create, Controlling level: Regions - Surfaces, Set Output Details, Link Data.
- Report heading 1 by setting own texts around the macro for {Report.ElementName} {Report.CurrentName}.
- To visually group the individual objects on the sheet, insert groups and use them as frames. To do this, in the group's properties, set the color of the frame to a subtle gray. Then move the other objects.
- The Customer Classification group consists of three Graphics and a Text for a legend replacement of the symbol analysis, four modified Table Objects that only show the sum and the column caption, and a Text for the heading.
- The Turnover indicators group consists of two Individual Pie charts with a legend for one of the two Pie charts and an Individual Bar chart. Here, you can set the heading from the heading of the individual Bar chart. The individual Bar chart uses the "Regions + Customer Base" table. It evaluates three products (maintenance, paper, and cartridges). The label indicates the absolute turnover figures. The individual pie chart to the left also uses the "Regions + Customer Base" table. It also evaluates the same three products (Maintenance, Paper, and Cartridges). The label, however, indicates the percentage turnover ratio. The individual pie chart on the right also uses the "Regions + Customer Base" table but only shows the sum of turnovers per region.
- The territory key figures are in a Table Object that has been accordingly modified in the "Territory + Customer Base" table.
- Inset Map add and make the settings according to our tips and tricks Report with inset map.
- Graphics and Texts are used for the explanations of the Regional Manager and Sales Representatives.
- As Graphic add a company logo and move it to the desired position.
The following tables were used:
- Customer Base
- Optimized Regional Locations
- Optimized Territories+Customers
- Optimized Regions+Customer Base
