Analyze
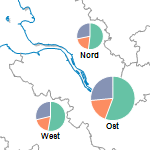
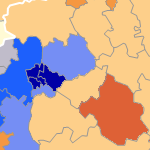
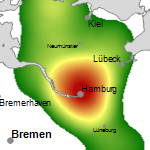
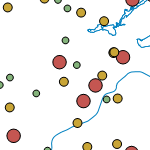
easymap offers various analysis functions to color the area areas on the map depending on the data or to provide them with diagrams (e.g. circle sector- or bar charts). For site analyses symbols and accessibility are available.
The following types of analysis are available:
- Data-driven coloring of district areas
- Location displays (symbols and accessibility)
- Lines and connections
- Chart analyses
- Data-driven labels
easymap has the appropriate legend for every analysis. These can be displayed in the Control window Contents or Analyses. Or you can insert the legend via the context menu of the analysis or via the control window Objects anywhere on the sheet via Drag&Drop.
Adding a New Analysis
A prerequisite for accessing the various analyses is that you have included a base map on a sheet.
All analyses can be added to the map via the control window Data or via the menu Analyze. In the control window Data they can be added to a table or table column on the map via Drag&Drop.
A dialog box opens where you:
- The method of Analysis
- The analysis type(only for analyses where a selection is necessary), and
- Select the Level and Assignation
- By clicking Ok, your analysis will promptly display on the map, along with its default settings.
If you would like to create an analysis without default settings, then select the Analyze tap from the main menu.
The further settings for the analysis can then be adjusted in the Properties dialog that opens. Like all other elements, the analysis can be made visible or invisible.
Note: It will only show you the possible options for selecting the table or the table column.
Editing Existing Analyses
If you have already inserted an analysis, you can still change certain settings later.
Changing the analysis settings
Open the context menu of the analyses in question in the Analyses control window or in the Contents control window. There, click the Properties... item, or double-click the analysis with the mouse.
You can then change the properties of the analysis.
Changing the data basis
You can change the data basis directly in the properties of the respective analysis by clicking on ... on the right side of the Table selection in the Data area of the Properties window under a property (for example, color or symbol) of the analysis and opening the Data Basis dialog box.
Alternatively: Open the context menu of the relevant analyses in the Contents or Analyses control window. From there, click on the Data basis... .
You can then change the settings for the data input.
Additional commands in the context menu of the analysis
You can right-click on an analysis in the control window Contents or on a selected object in the map window to open its context menu (right-click). This offers some actions that can be performed on this object.
All actions that can be applied to an analysis can also be found in the respective properties window of the analysis.
| Transfer Selection to |
Transfers the current selection geographically to another object. Details... |
| Visible |
Shows whether the object is visible and allows switching the visibility. |
| Order |
Here you can change the selected element in the character sequence. Another option is to drag and drop the selected element within the content view. |
| Align |
Aligns several objects flush or aligns an object within its parent object. Details... |
| Convert | This command is only available for cartographical diagram and individual diagrams. This changes the type and subtype of the diagram, e.g. changing from pie sector chart to stacked bar diagrams. |
| Input Data... |
Displays the data settings for the selected analysis. You can use this command later to change the connection between the analysis and the data. Further information can be found here. |
| Show Results Table | Displays the results of the selected analysis in a table. |
| Ignore filter |
Defines whether an Analysis filter should be considered or not. |
| Place Elements |
Allows automatic placement of analysis symbols according to various criteria. Further information can be found here. |
| Clip Map |
Here you can define a different clip map for the analysis. |
| Restore Original Position | Executing this command places all moved texts or symbols at their original position. |
| Restore defaults |
Undoes all manual changes to this layer. |
| Map XY |
Here you will find various commands for the map. |
| Copy |
Copy the object (if necessary with all subobjects) to the clipboard to paste it elsewhere. The object can be inserted in other applications as a graphic, or inserted in EasyMap as a copy of this object using the Insert command. |
| Paste |
Pastes the contents of the clipboard into this object as a child object. |
| Delete | Deletes the selected element. (See also: delete objects) |
|
Rename |
Changes the content view to an edit mode to give the object a new name. (This can also be achieved by clicking on an object that has already been marked.) |
| Properties... |
Opens a properties dialog in which you can edit the Properties of the selected object. If several objects are selected, many properties can also be changed simultaneously for these objects. |
