Analyze
This workbook contains various analyses on different tables. In addition to maps on German postal codes, this workbook also contains evaluations on Austrian and Swiss postal codes. So that you can assign the tables to the correct countries, the sheets and tables are provided with a two-character country abbreviation.
The workbook contains the following sheets:
- Distribution of sales DE
- Trade and transport DE
- Population pyramids AT
- Boston Grid CH
- Radio station AT
Distribution of sales DE
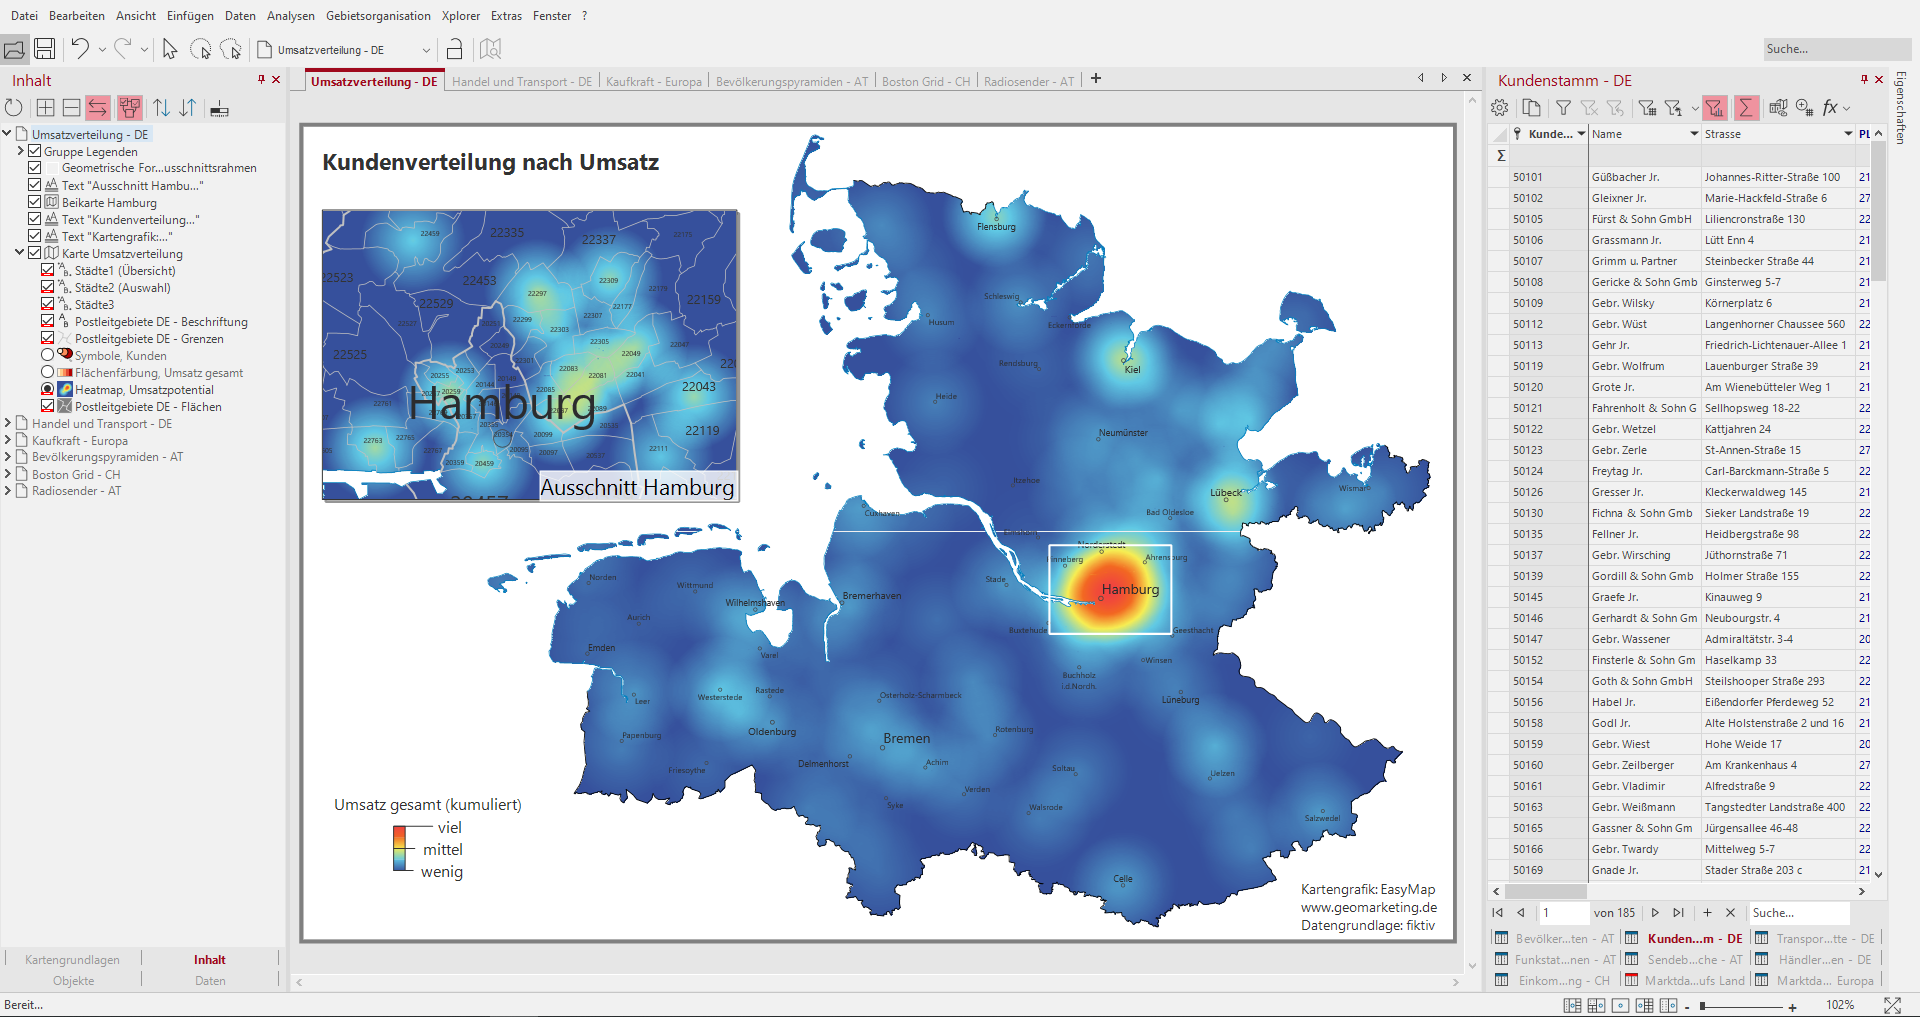
This sheet shows you a Heatmap sales potential and the sales trend in postal zone 2 of Germany. There is also an inset map section of Hamburg. The Color legend of the heatmap, depicts where there is a high sales concentration and where not.
Using the Content control window, you can also display the sales distribution as area coloring, total sales or as symbols, customers. All three analyses are based on the same column of data in the "Customer Master DE" table and can be selected by clicking on the radio button, as they are in the same visibility group. In addition, there is a legend for each analysis in the Content control window. The map view is reduced to the essentials by deleting topographic layers such as highways, interstates, rivers, and bodies of water.
How you can recreate this map:
- Analysis selection Heatmap with the subtype location-based, settings: "total sales" data column, 25 km radius, linear descending, continuous gradient slightly modified from default. In the Content control window, a legend is automatically generated.
- Analysis selection area coloring, settings: "Total Sales" data column and 5 classes with a user-defined classification in round thousand increments. In the Content control window, a legend is automatically generated.
- Select analysis symbols for locations, settings: Total Sales data column, select icons, set size and color. In the Content control window, a legend is automatically created.
- Place all three analyses in a Mutual visibility group, so that only one of the three can be made visible in the Content control window.
- Color Legend for all three analyses drag onto the sheet
- Inset Map select the map Distribution Turnover and drag it into the sheet. Zoom in on the marked map to set the section on Hamburg.
- Geometric shape Select Freehand Graphic and drag the frame around Hamburg onto the map. Set the Border Color to white and the Fill to No Color.
- Text Box insert for Header and Footnotes.
The following tables were used:
- Customer base - DE
Trade and transport DE

This sheet shows the relationship between dealers and transport chains displayed via Relations analysis and Symbols analysis. The postcode areas in postal zone 2 serve as the map basis. In the Content control window, you can switch between the dealer relationship with dealer locations and the transportation chain with logistics centers by selecting one of the analyses for relations. The relations analyses and symbols analyses are both Mutual visibility and Simultaneous visibility grouped and show you the interaction of the different visibility groups. To better estimate the distances between the locations, a Scale is inserted on the sheet.
Since the Relations analysis is the focus of attention, topographical levels are, therefore, not included in the map. The Internet map in grey tones provides better spatial orientation.
How you can recreate this map:
- Trader Relationships: Selecting analysis relationships with uniform dashing; color by characteristic of the "Dealer" data column and line width in five classes by user-defined classification of the "Distance (in km)" data column.
- Dealer locations: select analysis symbols with the "Dealer" data column and a classification by characteristic; customize color, shape, and size.
-
Transport chains: Selection of analysis Relations with column "TEU", four classes with a user-defined classification.
-
Routes:Selecting analysis Calculate Route by shortest trvale distance by Car transportation. Draw routes on the map from the territory location to the customer.
- Logistics centers: Selection of the analysis Symbols with the data column "Location" and a classification according to characteristic.
- A combined legend was inserted for the dealer locations as well as for the relations of the transport chain.
- The analyses of the traders (symbols and relationships) were packed into a Simultaneous visibility group. A further simultaneous visibility group was formed for the logistics centres and the transport chain, then to form a mutual visibility group with the other simultaneous visibility group.
- Drag a Internet map onto the map and select the BKG WebAtlasDE.light in grayscale.
- Insert a Scale from the control window Objects onto the sheet and in the settings select the Number of Sectors to 5 with a Total Width 50 km and a Sector Width of 10.
- Insert Text for header and footer.
The following tables were used:
- Transport chain - DE
- Dealer relationships - DE
Population pyramids AT

This sheet shows the age distribution by sex and the population distribution at the level of the Austrian postcode regions. Here, several area colourings and bar chartshave been combined. To aid understanding of the data, tooltips are included for the analyses, displaying information as you move over the map.
In the overall view of the map, there is a area coloring for the level postal routing regions AT. Only when you zoom into the map, the view changes to a area coloring on the level of the postal codes AT. This visibility change is implemented with the zoom automatic by setting different visibility levels for the area colorings. The color legends are tied to the different visibility levels of the analysis and are only visible when the associated analysis is visible. Just zoom into the map and see how the area colorings behave. For both area colorings, there is a legend in the Contents control window.
The Bar chart analysis is used twice to obtain the age distribution of men and women. The chart depicting women grows to the right while for the men to the left. Create a population pyramid by aligning the two bar charts. Both Color legends are positioned next to each other, enabling the use of only one label for both diagrams. This way, the map does not appear too overloaded.
A Stand-alone chart highlights the difference in the age between men and women.
How you can recreate this map:
- Selection of analysis area coloring at the postcode region level with the settings: Classification using "Inhabitants" data column and selecting classification equally distributed, insert tooltip with population numbers. In the Content control window, a legend is automatically generated.
- Selection of analysis area coloring at the postcode area level with the settings: Classification using "Inhabitants" data column and selecting classification equally distributed, insert tooltip with population numbers. In the Content control window, a legend is automatically generated.
- In the Content control window, adjust the Scale Ranges to match the two Area Shadings.
- Select the Column Chart analysis and in the Settings: Select all data columns for the age groups of men, Color gradient from light blue for the youngest to dark blue for the oldest age group, in the Details set the alignment of the bars to the left.
- Select the Column Chart analysis and in the Settings: Select all the data columns for the age groups of the women, Color gradient from light red for the youngest to dark red for the oldest age group, in the Details set the alignment of the bars to the right.
- Select the Stand-alone of the object, and in the Settings: Select the table "Population data Austria", Pie Chart, Number of data columns to 2, select the data column "Age from 85 (each for men/women)" and set the Color, Size and Format of the chart.
- Color Legend Add the Area Shadings and Bar Charts. Then position the Men and Women Bar Charts legends next to each other.
- Text Box for header and footer.
The following tables were used:
- Population data - AT
Boston Grid CH
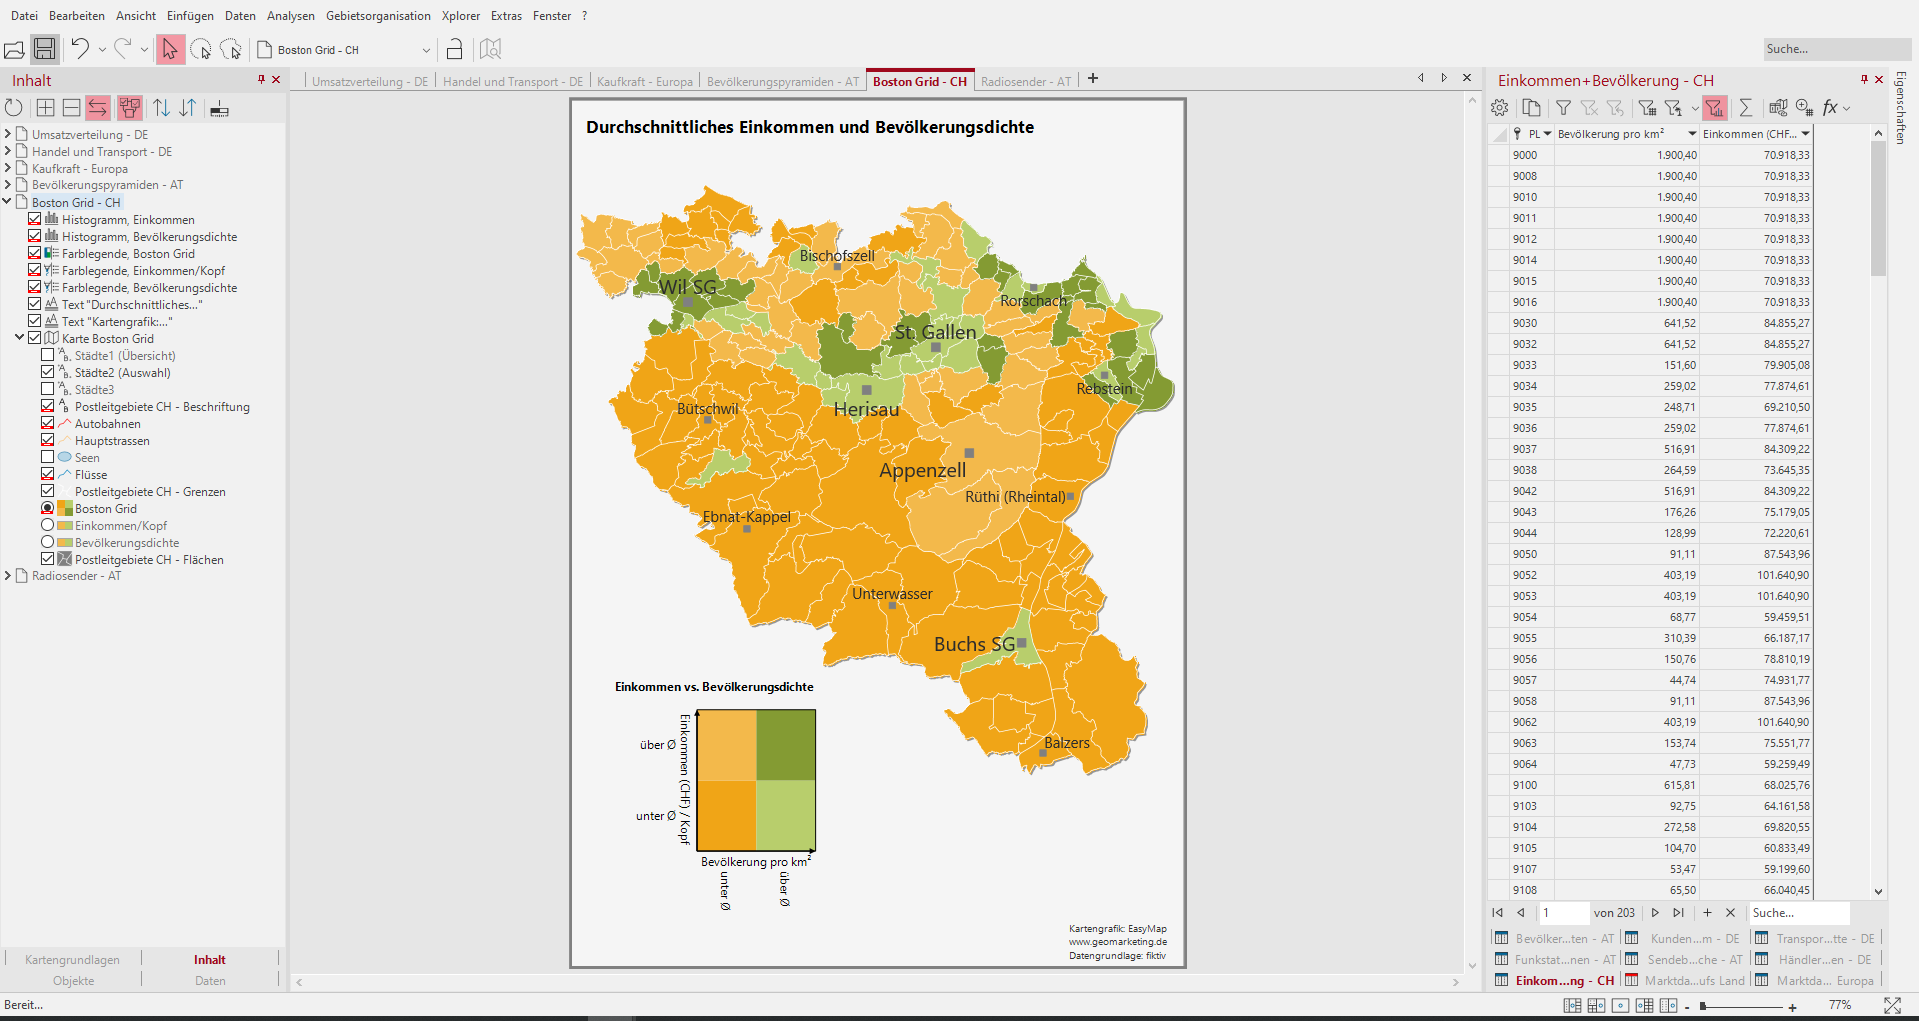
This sheet shows a Boston Grid analysis of the variables "average income" and "population density" for the postal control areas of postal zone 9 in Switzerland and Liechtenstein. For example, it is easy to identify areas characterized by high average income and high population density. Two separate area colorings and histograms were also created for the two variables. The three area analyses were set to visibility setting "reciprocally visible". For better understanding of the data, tooltips have been added to the analyses, which are displayed when hovering over the map. There are legends for all three analyses in the control window content.
How you can recreate this map:
- Select analysis Boston Grid with settings: Average classification for every two columns of data, Set colors, and Insert tooltip. A legend is automatically created in the Content control window.
- Analysis area coloring selection with settings: Average classification over population per sq km data column. , set colors, insert tooltip. In the Content control window, a legend is automatically generated.
- Selecting the analysis area coloring with the settings Average classification over the data column "Income/Head", Set colors, Insert tooltip. In the Content control window, a legend is automatically generated.
- Select Histogram and legends for the two Area Shadings
- Select the levels of analysis and assign a name for the Mutual Visibility group under Properties.
- Text Box for header and footer.
The following tables were used:
- Income+Population - CH
Radio station AT
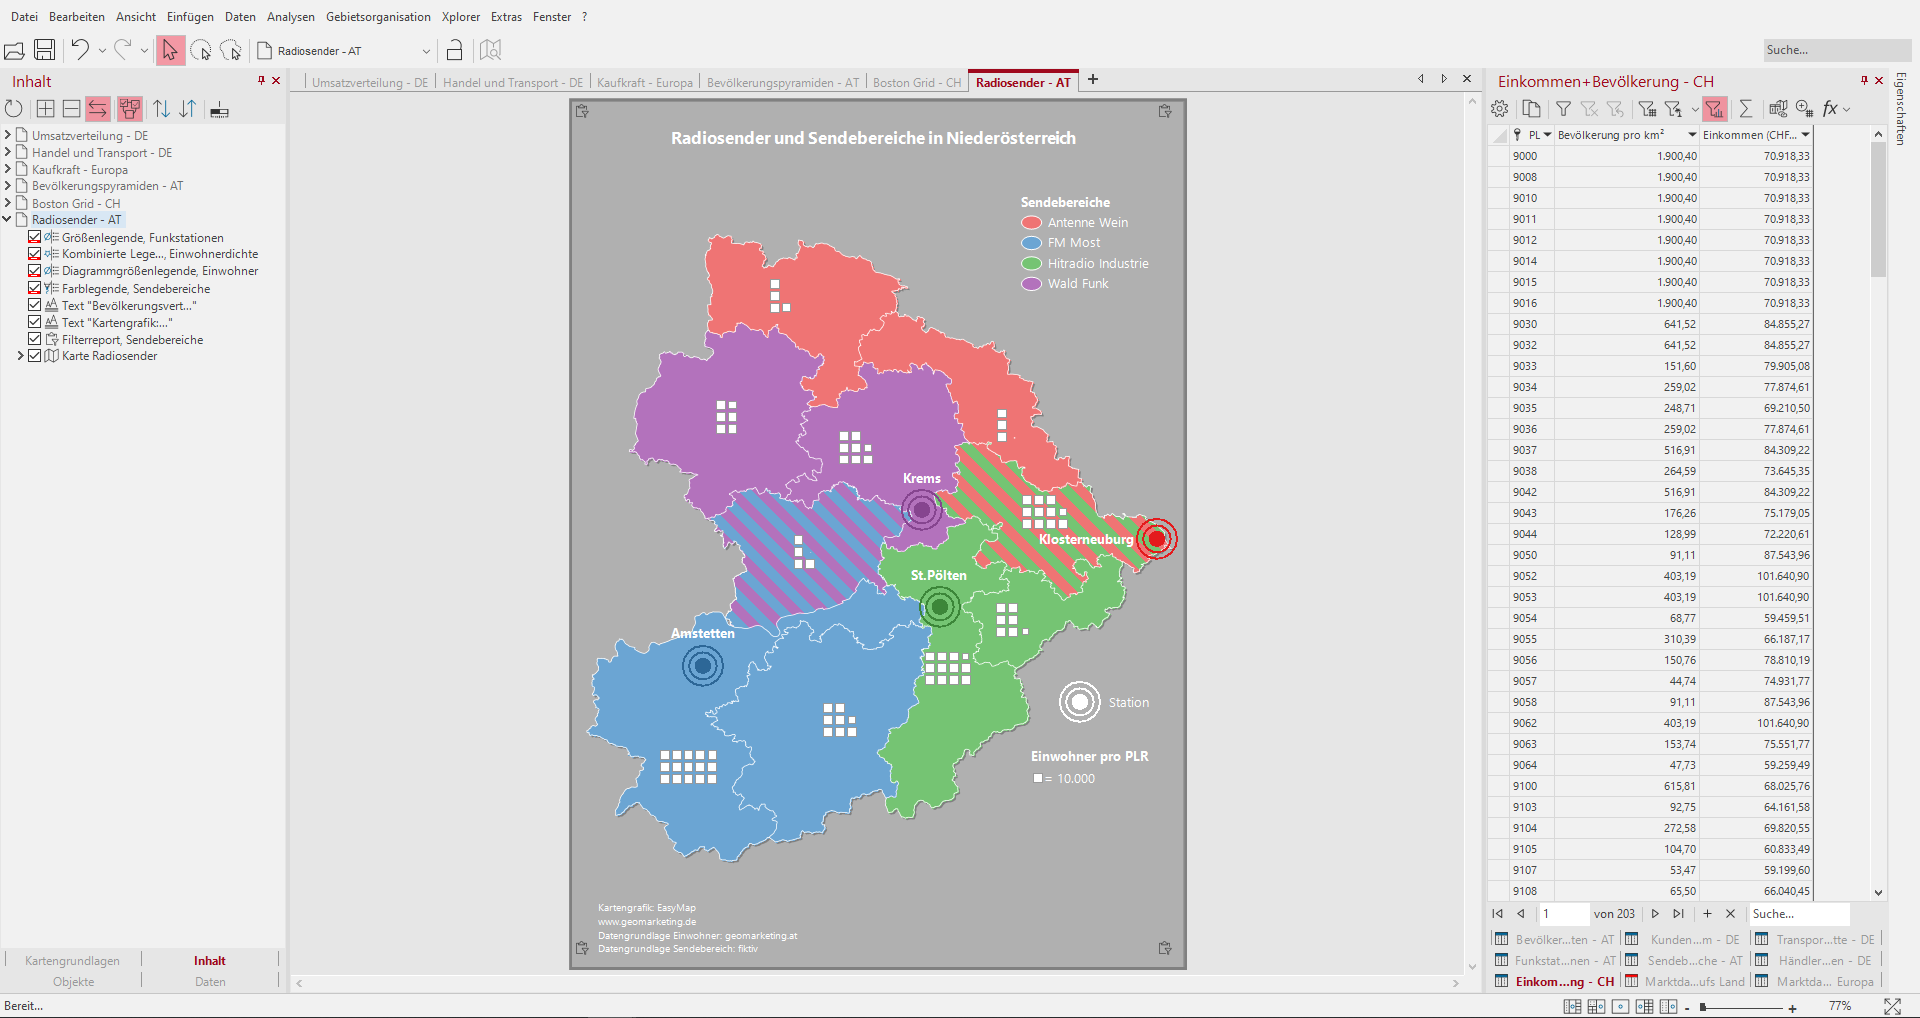
This sheet shows broadcasting areas and radio houses of different radio stations in the Austrian postcode zone 3. Overlaps of the broadcasting areas are shown by means of area hatching within Lower Austria. For area hatching, the areas with several assignments must also be available several times as single rows in the table, because this is the only way to display an area hatched. The radio stations are shown as symbol analysis. In addition, population figures are visible in counting diagrams.
How you can recreate this map:
- Selection of analysis area hatching with the settings: "Transmitter" data column from the "Transmitter Areas - AT" table, classification via feature and selection of width and type of hatching.
- Selection of analysis Symbols with the settings: Selection of a symbol - data-independent, symbol color - data column "Sender" from the "Transmitting areas - AT" classified by characteristic and size of the symbols - data-independent.
- Selecting analysis count chart to display residents with settings: Number of segments and color, detail setting (symbol, value per symbol).
- Color Legend for area hatching.
- Text Box for header and footer.
The following tables were used:
- Radio stations - AT
- Transmission ranges - AT
- Population per PLR
