
Territory Organization on Areas
In this workbook we show you how easy it is to create a territory structure with locations based on postal codes. In addition, all territory analyses are presented and an attractive export sheet is generated.
The workbook contains the following sheets:
Planning at area level

On this sheet you can see a 2-stage territory structure with areas and regions. The colouring of the areas is set hierarchically to the superior regions, so that a simple visual allocation of areas to the regions is possible. The locations of the areas and regions are also kept in the colors of the layers. In addition, the sites are identified by a relationship between "area sites" and "region sites". Sales for the Maintenance, Paper and Cartridge divisions per region are shown using a column diagram. The column diagrams are labeled below with the names of the region and above the individual columns with the specific sales amount. The colour legend above the column diagrams serves to inform the product divisions. The Table object to the table "Territories+customer base" at the bottom left of the sheet provides more information on the individual territories, such as something the number of customers and the total sales. Since the colors of the areas are contained in the table object, it can also be used as a replacement for a legend.
In the data window on the right-hand side, you can switch between the territory work tables "Territories+Customer Base" and "Regions+Customer Base" in the upper area. In the lower area you can switch between the imported table "Customer master", the query "Complete assignment" and the work table "Postal code areas+Customer master".
So you can recreate this map:
- Data for the territory structure (e.g. names of areas and allocations) on the basis of postal code areas.
- Planning Mode and create a Create new territory structure using the wizard.
- Create locationseach for the areas and regions in a separate step.
- In the control window Territory organization via the context menu of the territory locations Show territory locations to superordinate locations Create.
- To the Territory Work Table "Territories", aggregate the customer data of the Customer Master table via Query Edit.
- Selection of the analysis Column diagram for the Regions layer with the settings: Selection of the data column "sales paper", "sales cartridges" and "sales maintenance", with corresponding color design. Set the property Data labeling to "Value" for the labeling of the columns under Details. Mark the column diagrams in the map mark and place them outside the regions and align them align.
- Color Legend for the analysis column chart and set it as the heading over the individual diagrams.
- table object for the Territory Work Table "Territories+Customer Base" and design it attractively.
- Area Legend for the regions.
- Text box for heading and footnote.
- Group for the individual territory analyses and move one heading, one legend and one histogram each.
The following tables were used:
- regular clientele
- Territories+Customers
- Regions+Customer base
Territory analyses
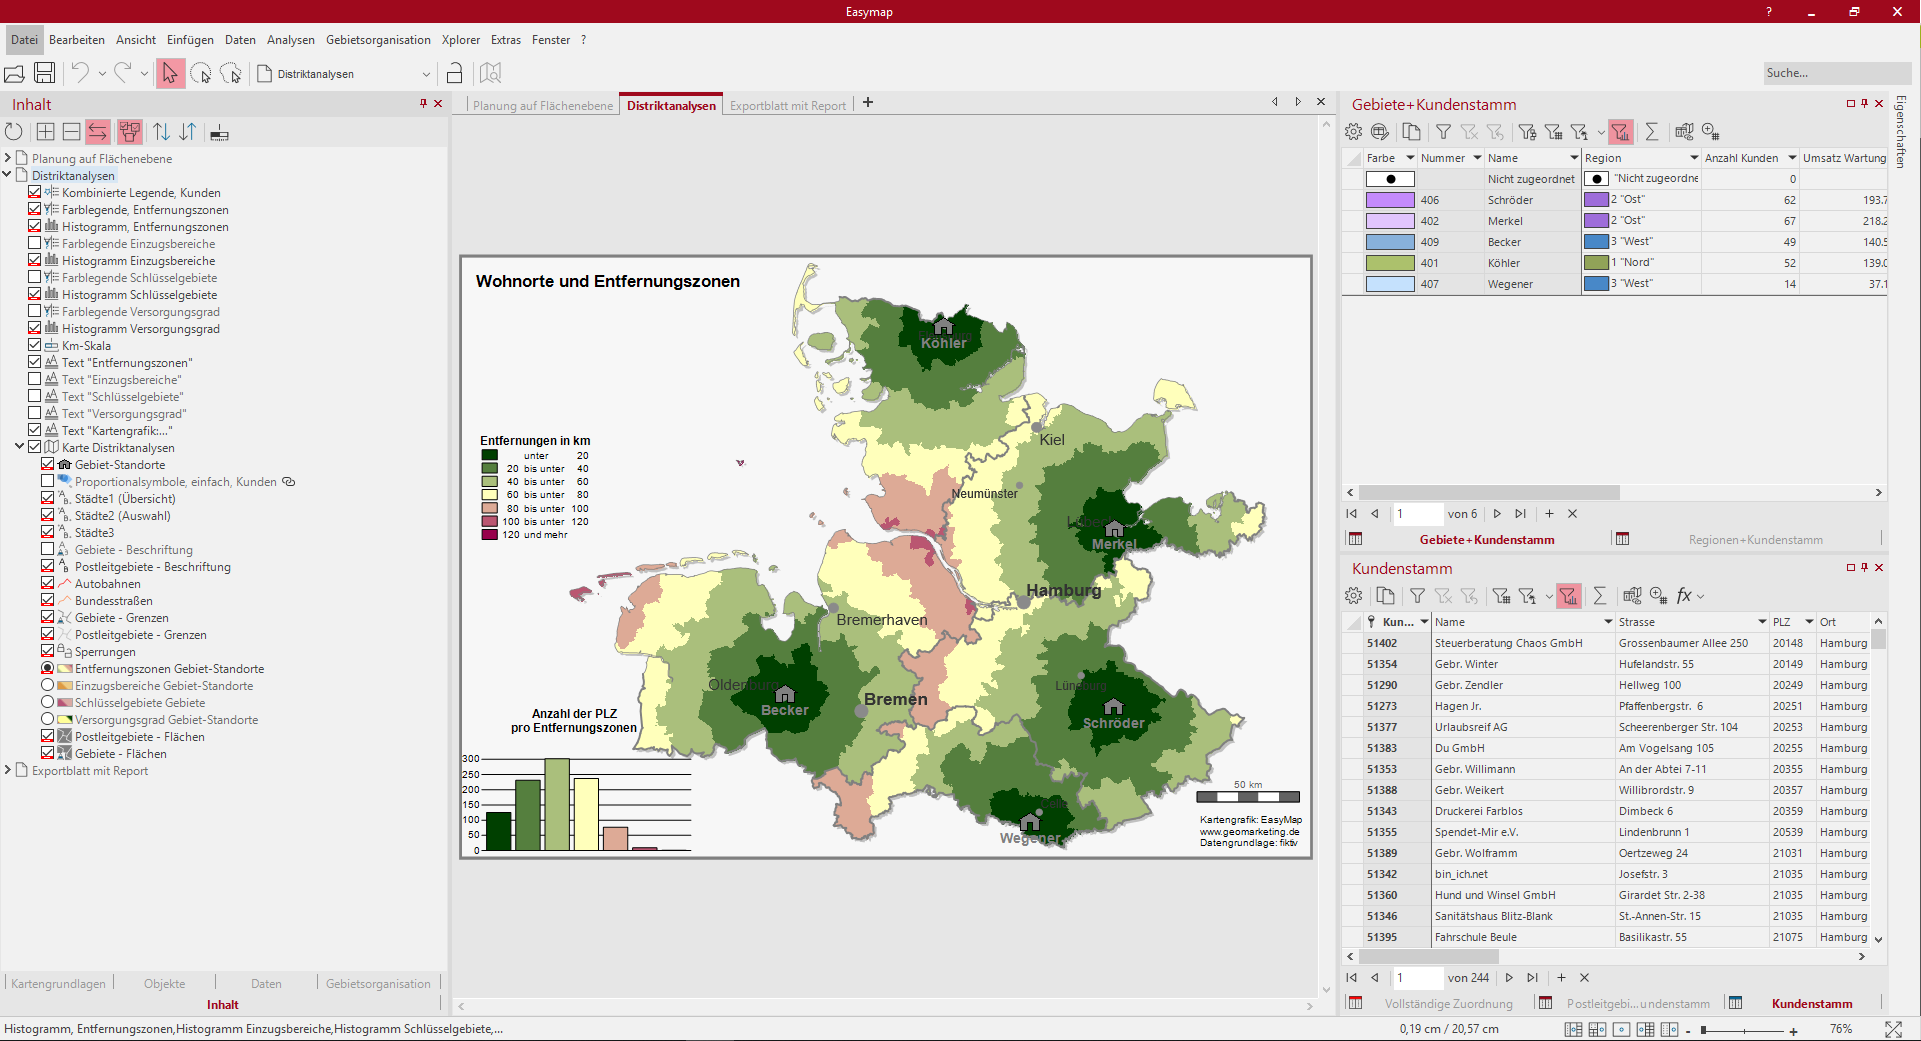
On this sheet the four different territorial analyses are inserted: distance zones, catchments, key areas and coverage based on plain territories In addition, the territory locations with a grey house are available on the map. The analyses are created via the control window Territory organization in the context menu of the levels. For the respective territory analysis, a suitable colour legend and a histogram were always created to illustrate the distribution across the individual classes. Finally, a scale has been placed in the map so that you can better estimate the distances on the map.
Via the control window Content you can switch between the individual territory analyses by clicking on the round radio buttons. The territory analyses belong to a mutual visibility group, so that only one analysis is to be seen at a time. The legends, the histogram and the headings change automatically as well, since they are compatible with the respective territory analysis in a Simultaneous visibility group. The symbols for the locations of the customers can also be made visible on the map.
So you can recreate this map:
- Drag the level "Areas" and "Area locations" of the Territory structure from the control window Area organisation onto the map.
- Select analysis distance zones in the layer context menu area locations, column settings (distance to location) and maintain colors that are class user defined classified (7 zones 20 km wide).
- Select the analysis Catchment areas in the context menu of the level Territory locations, set the property Calculation with Territory comparability to Territory-related evaluation (percentage), set the data column to "Total sales", retain the color settings and the classes.
- Select the analysis key areas in the context menu of the level areas, set the property Calculation with comparability of territories to territory-related evaluation (percentage), set the data column to "Total sales", keep the settings of the color and the classes.
- Select the analysis Coverage level Starting from the Territory locations, set the property Calculation of Capacity to "50" and select Distance to location as column, keep colors and classes.
- Insert Color legend andHistogram for each territory analysis and Content the Headline adjust if necessary.
- Text box for the heading for each analysis.
- Simultaneous visibility group for each analysis with the corresponding heading, the histogram and legend are already internally linked to the analysis.
- Alternating visibility group for the territory analyses, so that only one territory analysis with the explanations is visible at a time.
- Select the analysis symbols with the settings: Analysis first couple, select the column "Classification" and classify according to feature, determine symbol, color and size for the respective feature.
- Combined Legend for the analysis Insert symbols.
- Scale for further designs.
- Group for the tables and the legends.
The following tables were used:
- regular clientele
-
Postal code areas+customer base
Export sheet with report

This sheet shows you an optimized representation of a map with Report for exports to other formats, such as image files or Office formats. To view the report, right-click Area report: Regions in the control window Content and select Display report preview from the context menu.
On the map the areas - areas as well as the area locations and region locations are visible. A customers have been visualized as symbol analysis and classified according to sales in the maintenance product segment. Two circuits with a radius of 20 and 40 km respectively can be seen starting from the region locations.
The sheet is additionally supplemented with two table objects, which adapt themselves accordingly in the report. In the lower part of the sheet you will also find a small inset map, which always highlights the section on the map where the region is located on the overall map. The individual chart to the right shows the distribution of customers in the ABC customer classification for each region.
So you can recreate this map:
- Drag the level "Areas" and "Area locations" of the Territory structure from the control window Area organisation onto the map.
- Selection of analysis symbols, setting: symbol via column "Classification" user-defined classified, color by column "Sales maintenance" classified, size by column "Classification" user-defined on A customers.
- Selection of the analysis Circles, two separate analyses for the radius 20 km and 40 km, in the settings Data column none set and at Radius enter the respective value, Border color set to black, in the details the Fill set to no color.
- Report on regions create, controlling plane: regions - surfaces, set output details, link data.
- Report heading 1 by setting own texts around the macro for {Report.ElementName} {Report.CurrentName}.
- Color Legend for symbol analysis.
- Stand-alone Chart for the work table "Territories+Customer Base" and select three columns A-, B- and C-Customers, which do not set colors to fill.
- Image and Text insert as legend for the locations of the areas and regions and align them to each other align.
- Inset Map and make the settings according to our tips and tricks Report with inset map.
- table object for the Territory work table, insert "Regions+Customer Base" and reduce to the columns with "Revenue Maintenance", "Revenue Paper", "Revenue Cartridges" and "Total", since Filter according to clip map is set in the table object, only the data from the displayed region is displayed.
- table object for the "Customer Master" table and expand the filter expression via Edit Filter: Visible and [Classification] = "A Customer", so that only the A customers in the table per region are displayed.
- As Graphic add a company logo and move it to the desired position.
- For an optical grouping of the individual objects in the map, insert a group and use it as frame. To do this, set the color of the frame to a subtle gray in the properties of the group. Then move the other objects.
The following tables were used:
- regular clientele
- regional locations
- Territories+Customers
- Regions+Customer base
