Area Legends
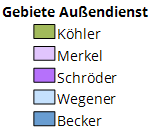
Area legends are a special type of color legends. They serve to explain the color used for the areas on the map.
Note: As an alternative for area legends, you may also use the Table object to get a concise listing of the data for each area.
How to insert the legend is explained here.
Editing the Content of the Area Legends
If you insert an area legend to the map, the areas appearing in the map are listed in the legend with color and standard label. The standard label is usually the name of the area. You can adjust the displayed text per area in the Text area of the Properties, retrievable in the control window content via the context menu of the legend. For example, the numbers and the number of devices can also be displayed in the legend - see Insert Text.
By default, up to 50 areas as well as empty areas without bricks are displayed. You can also change these default settings in the Properties of the area legend. In the section Settings, you can increase the Maximum Number of Regions on Display to show more areas in hte legend. The visibility of the areas on the map does not affect this setting. You can exclude empty or unassigned areas from the legend using the Empty Regions command in the section Options.
Legend Properties
The properties of the legend can be accessed via the context menu of the legend in the control window Content or directly via the legend in the map. There you can, for example, change the wording of the heading or make further settings for the font and display.
Select the section whose settings you want to see in detail:
|
Caption and Editability |
|
| Caption |
Specify a name here to be able to find the element more quickly in the Contents control window. For analyses, maps or sheets, you should use a name that contains the topic. EasyMap assigns generic names for new elements (e.g. map 1). If you do not change these, you will later have great difficulty in finding certain content in workbookn. |
| Comment |
Enter here a comment for the display of the workbook in EasyMap Xplorer. The comment is also displayed in EasyMap as a tooltip in the control window Contents. |
| Visibility | |
| General |
Here you can control the visibility of objects and elements. |
| Alternating visibility group |
Set a group for mutual visibility here. If the element is to be made equally visible with other elements, you must use the same name for the visibility group. |
| Simultaneous visibility group |
Set a group for simultaneous visibility here. If the element is to be made mutually visible with other elements, you must use the same name for the visibility group. |
| Reference | |
| Map |
Select the map to which the legend should refer. |
| Location | |
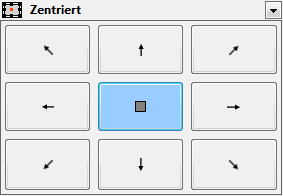
| Anchor point |
Select the point from which the size of the element is to be calculated.
|
| Offset Left |
In conjunction with the reference point, the distance in cm from the left. |
| Offset from Top |
In conjunction with the reference point, the distance in cm from the top. |
| Size | |
| Width |
Width of the object in cm. |
| Height |
Height of the object in cm. |
| Header | |
| Content |
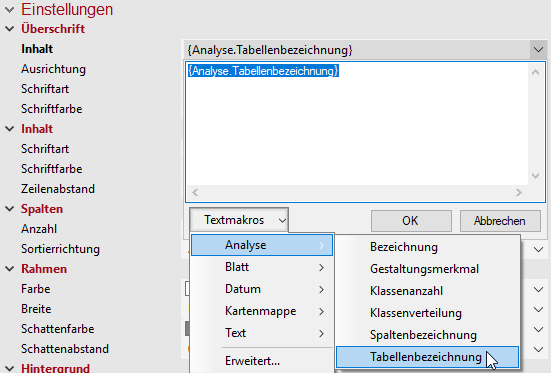
Heading of the legend, table or single diagram or of the text to be displayed in the map. As a rule, the text is output via a text macro (you can recognize text macros by their curly brackets). For analyses, the wording of the legend consists of the name of the column used for the analysis. You can use additional text macros for the heading. For example, you can use a text macro to force the system to display the name of the analysis or the names of the table used. To do this, expand the text box next to the Header setting and click Text Macros > Analyse, then select Name or Table Name.
More information on the individual expression categories of text macros can be found here. |
| Alignment |
Here you can set how the text is aligned (within the legend or table). |
| Font |
Defines the font of the heading. |
| Font Color |
Specifies the font color of the heading. You can specify the color using the color selection field or directly as an HTML color value. |
| Content | |
| Font |
Defines the font of the content. |
| Font Color |
Specifies the font color of the content. You can specify the color using the color selection field or directly as an HTML color value. |
| Line Spacing |
To make the legend easier to read, you can increase the line spacing between the individual elements. |
| Empty Regions | Specify here whether you want to list areas in your area legend that are not visible on the map because they do not have a geographical extension. For example, a district can be "empty" because no bricks are assigned to it. It exists in the district table and organigram, but is not shown on the map. |
| Maximum Number of Regions on Display | If the list of regions is very long, you can specify how many are actually listed in the legend. |
| Region Selection | Specify here whether the legend should contain only those areas which are shown in the iclip map or all regions. |
| Text for Further Regions | Enter here the text that should appear for the regions not listed. |
| Data | |
| Count | Here you set the number of columns to be displayed. |
| Sorting Order | Sorting Direction of the columns - ascending or descending. |
| Sort By | Specify here whether you want to sort according to the number or name of the areas. |
| Style | |
| Shape |
Select the shape of the color box in the legend here. |
| Border | |
| Color |
Specifies the color in which the frame around an object is to be drawn. You can specify the color using the color selection field or directly as HTML color value. If no color is specified, no frame is displayed. |
| Width |
If a frame is displayed around the object, the width of this frame can be set here. |
| Shadow Color |
Specifies the color in which a shadow representation of the object is to be drawn. You can specify the color using the color selection field or directly as HTML color value. If no color is specified, no shadow is displayed. |
| Shadow Spacing |
If a shadow is displayed to the object, the distance or width of this shadow can be set here. |
| Background | |
| Fill |
Define the background of your element here. You can specify the color or the fill effect using the Color Selection Box or directly as HTML color value. |