Single diagrams based on tables
If you select a table as the data basis for the individual diagram, you must then select or define all design details (including diagram type, number of sectors or bars, colors, sizes). By default, the diagram displays the sum of the data in the selected columns of the underlying table. If this is not desired, after inserting the diagram, open its Properties (see above) and select Details another Aggregation (e.g. Average) on the area.
Object-related settings are only available after recalling Properties.
Properties
Setting options in detail:
| Caption and Editability | |
| Caption |
Specify a name here to be able to find the element more quickly in the Contents control window. For analyses, maps or sheets, you should use a name that contains the topic. EasyMap assigns generic names for new elements (e.g. map 1). If you do not change these, you will later have great difficulty in finding certain content in workbookn. |
| Visibility | |
| General |
Here you can control the visibility of objects and elements. |
| Alternating visibility group |
Set a group for mutual visibility here. If the element is to be made equally visible with other elements, you must use the same name for the visibility group. |
| Simultaneous visibility group |
Set a group for simultaneous visibility here. If the element is to be made mutually visible with other elements, you must use the same name for the visibility group. |
| Reference | |
| Table |
The table on which this table object is based. Note: If you convert an existing table object to a new table, some settings (for example, column visibility, filter) cannot be transferred and must be reset. |
| Location | |
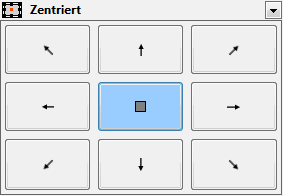
| Anchor point |
Select the point from which the size of the element is to be calculated.
|
| Offset Left |
In conjunction with the reference point, the distance in cm from the left. |
| Offset from Top |
In conjunction with the reference point, the distance in cm from the top. |
| Size | |
| Width |
Width of the object in cm. |
| Height |
Height of the object in cm. |
| Header | ||
| Content |
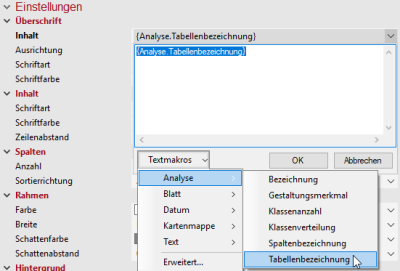
Heading of the legend, table or single diagram or of the text to be displayed in the map. As a rule, the text is output via a text macro (you can recognize text macros by their curly brackets). For analyses, the wording of the legend consists of the name of the column used for the analysis. You can use additional text macros for the heading. For example, you can use a text macro to force the system to display the name of the analysis or the names of the table used. To do this, expand the text box next to the Header setting and click Text Macros > Analyse, then select Name or Table Name. More information on the individual expression categories of text macros can be found here. |
|
| Alignment |
Here you can set how the text is aligned (within the legend or table). |
|
| Font |
Defines the font of the heading. |
|
| Font Color |
Specifies the font color of the heading. You can specify the color using the color selection field or directly as an HTML color value. |
|
| Border | ||
| Color |
Specifies the color in which the frame around an object is to be drawn. You can specify the color using the color selection field or directly as HTML color value. If no color is specified, no frame is displayed. |
|
| Width |
If a frame is displayed around the object, the width of this frame can be set here. |
|
| Shadow Color |
Specifies the color in which a shadow representation of the object is to be drawn. You can specify the color using the color selection field or directly as HTML color value. If no color is specified, no shadow is displayed. |
|
| Shadow Spacing |
If a shadow is displayed to the object, the distance or width of this shadow can be set here. |
|
| Background | ||
| Fill |
Define the background of your element here. You can specify the color or the fill effect using the Color Selection Box or directly as HTML color value. |
|
Commands
You can right-click on an object in the control window Contents or on a selected object in the map window to open its context menu. This offers some actions that can be performed on this object.
| Select other Object |
If you do not want to select the uppermost object at the mouse position, but an object below it, you can select this using the selection list. Besides locking the selection level, this is the only way to select objects that are hidden by other objects. |
| Transfer Selection to |
Transfers the current selection geographically to another object. Details... |
| Visible |
Shows whether the object is visible and allows switching the visibility. |
| Order |
Here you can change the selected element in the character sequence. Another option is to drag and drop the selected element within the content view. |
| Align |
Aligns several objects flush or aligns an object within its parent object. Details... |
| Ignore filter |
Defines whether an Analysis filter should be considered or not. |
| Convert |
Only available for analyses that display cartographical diagrams (pie diagrams, column/bar diagrams, counting diagrams) and for individual diagrams. You can change the Type and Subtype of the chart (switching between types Circle chart, columns/bar charts, counting charts), e.g. you can directly convert circle sector diagrams into bar charts, stacked.... Most of the settings are applied if existing settings are still relevant for the new diagram type. Note: When converting to counting diagrams, it is essential that you check the value for value per symbol, since this value cannot be determined automatically and may be selected unfavorably. |
| Refresh Layout |
In rare cases, it may be useful to rebuild a legend element after extensive changes have been made. This order forces this. |
| Copy |
Copy the object (if necessary with all subobjects) to the clipboard to paste it elsewhere. The object can be inserted in other applications as a graphic, or inserted in EasyMap as a copy of this object using the Insert command. |
| Paste |
Pastes the contents of the clipboard into this object as a child object. |
| Delete |
Deletes the selected element. (See also: delete objects) |
| Rename |
Changes the content view to an edit mode to give the object a new name. (This can also be achieved by clicking on an object that has already been marked.) |
| Properties |
Opens a properties dialog in which you can edit the Properties of the selected object. If several objects are selected, many properties can also be changed simultaneously for these objects. |


