Result data
As soon as the calculation has been successfully completed, the tables resulting from the visit and utilization calculation are inserted in the data control window.
The names of the results tables always contain the prefix according to the name in the settings of the calculation basis + the addition "xxx - Tours", "xxx - Visits" and, if applicable, "xxx - Unplanned visits". More than one planning can be carried out with the same basic data, i.e. please ensure that the names are appropriate so that the results tables can be subsequently distinguished.
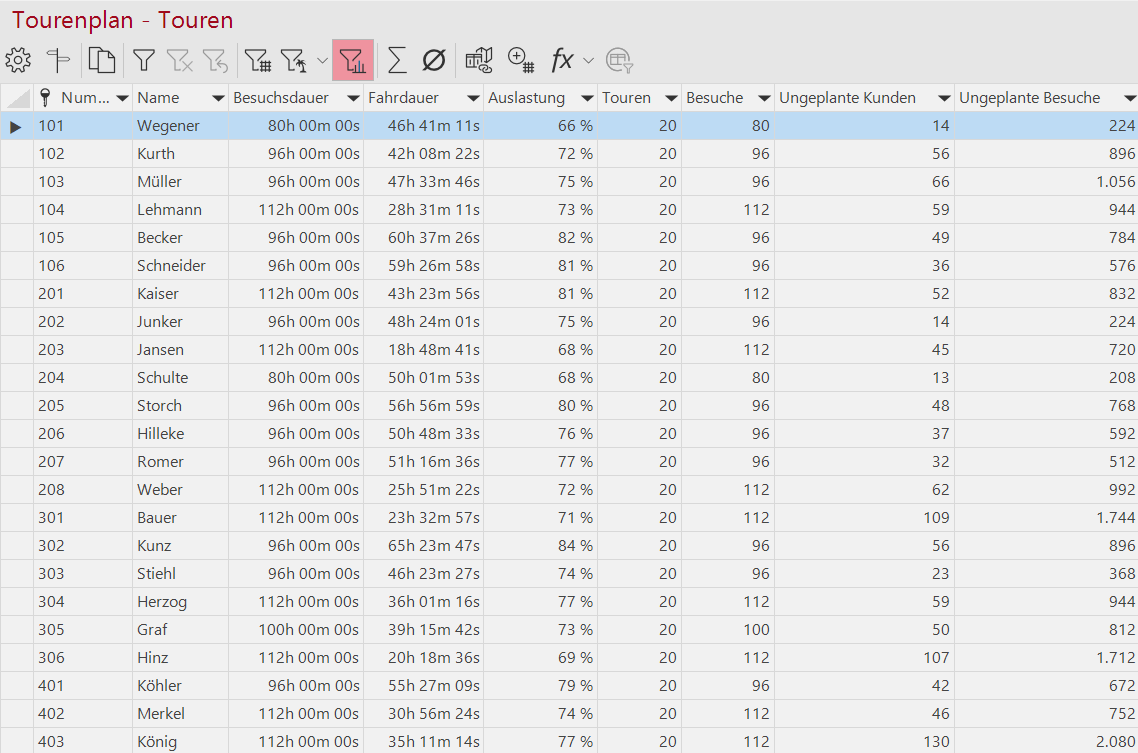
Plan - Tours
First, we receive an overview list of all tours in which the values have been grouped for each of our locations and within the assigned planning horizon. In this list, we can get an overview of the number of tours and visits per employee, the total visit duration, travel times and utilization. This allows us to quickly define distinctions between the values of all employees.
Plan - Visits
It is a detailed table of all customer visits for all our employees within the assigned planning horizon.
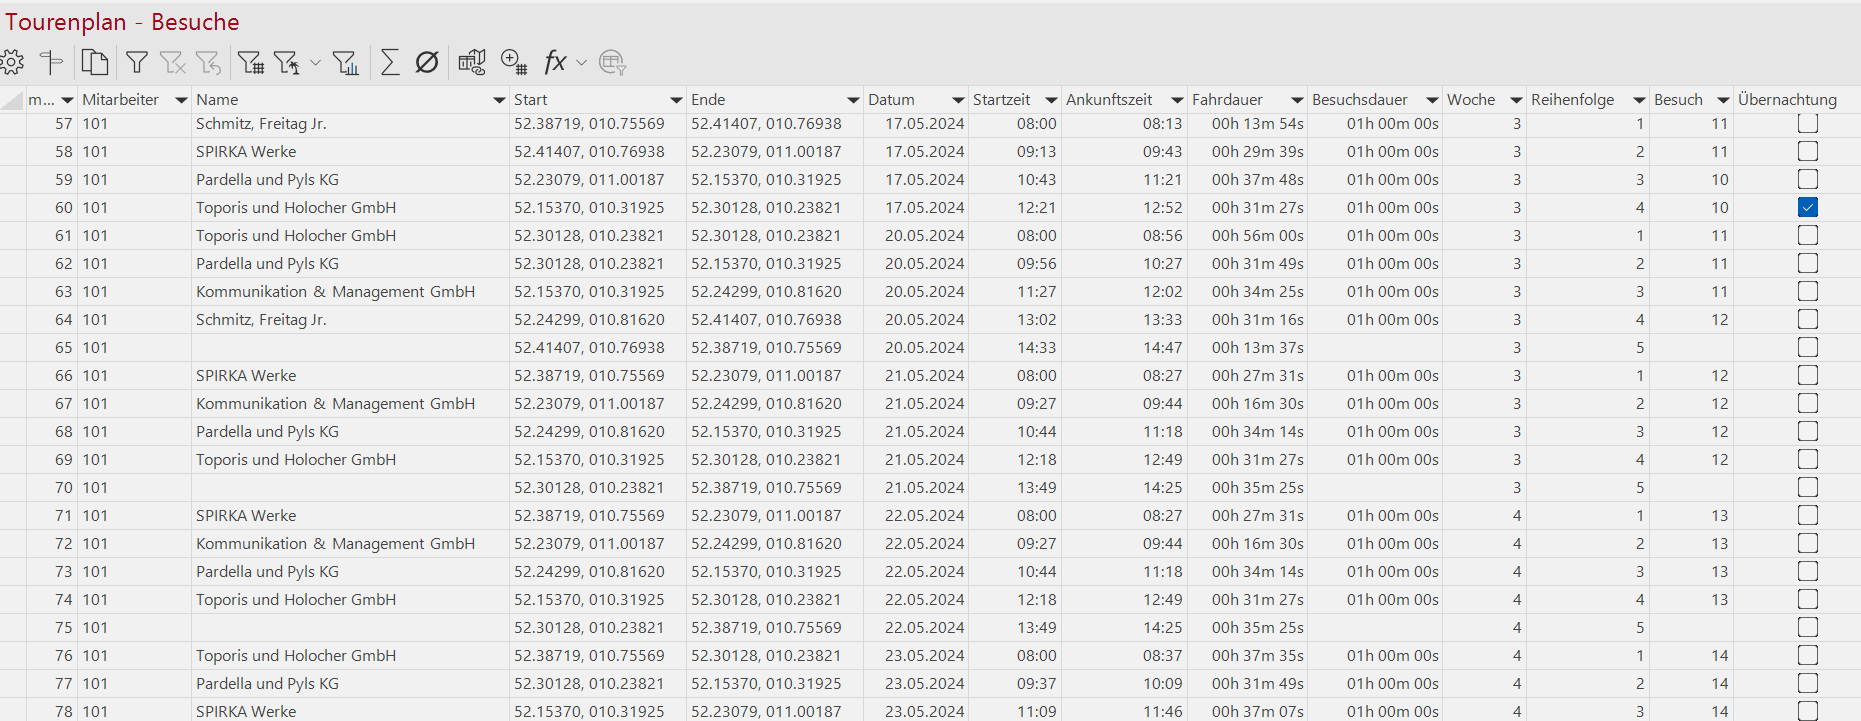
Note: The lines that do not contain a customer name or visit duration refer to the return journey or the end of the tour.
Each customer visit receives the following information:
|
Number |
Line number |
| Employees | Employee number or name |
| Customer |
Customer number |
| name | Customer name |
| Start | Coordinates where the tour starts |
| End | Coordinates where the tour ends |
| Date | Date of the tour |
| Start time | Start time of the tour |
| Arrival time | End time of the tour |
| Travel time | Travel time from one customer to the next or from home to customer and vice versa |
| Duration of visit | Time that the employee spends with the customer |
| week | week within our planning horizon |
| Sequence | Order of visits in one day |
| Visit | Visit for the same customer. A 2 here means the second visit to this customer for this tour plan |
| Overnight stay | The column shows us with a tick whether the employee is staying overnight on one day or another |
Unplanned visits
As all visits are planned in the workload calculation, the workload can be over 100%. This gives you an overview of the employees' actual workload. With a visit calculation, on the other hand, an attempt is made to easymapthat the employee utilization rate remains below 100%. This means that visits are categorized as unplanned visits if the employee's utilization rate for a working day or working week exceeds 100%. This list is therefore only generated during the visit calculation.
This list contains all visits that cannot be realized within the planning horizon.
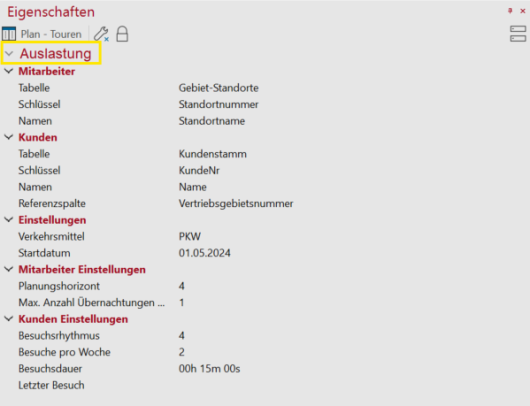
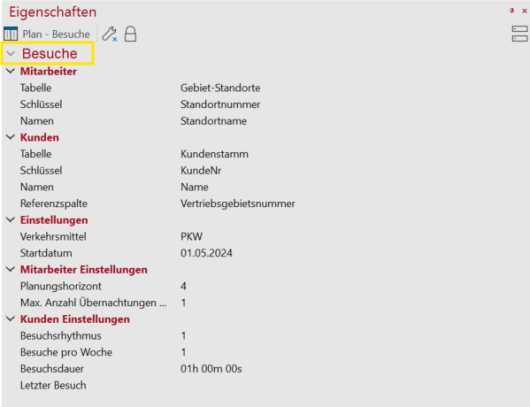
Properties
Using the Properties context menu of the results table in the Data control window, the individual parameters used from the Utilization and visit planning can be displayed retrospectively.
Edit tour plan
Due to a new area assignment or a new visit plan, you may want to perform the calculation again retrospectively. To edit the calculation retrospectively, we need to open one of the results tables in the Data control window and click on the  (Edit query) button above this table. easymap will reopen the wizard with the options and parameters selected for the tour plan. As soon as you have made the desired changes and click on Complete, the utilization or visit planning will be recalculated.
Visualization of the results
Automatic display of tours is not currently supported. Use the relationship analysis for this.
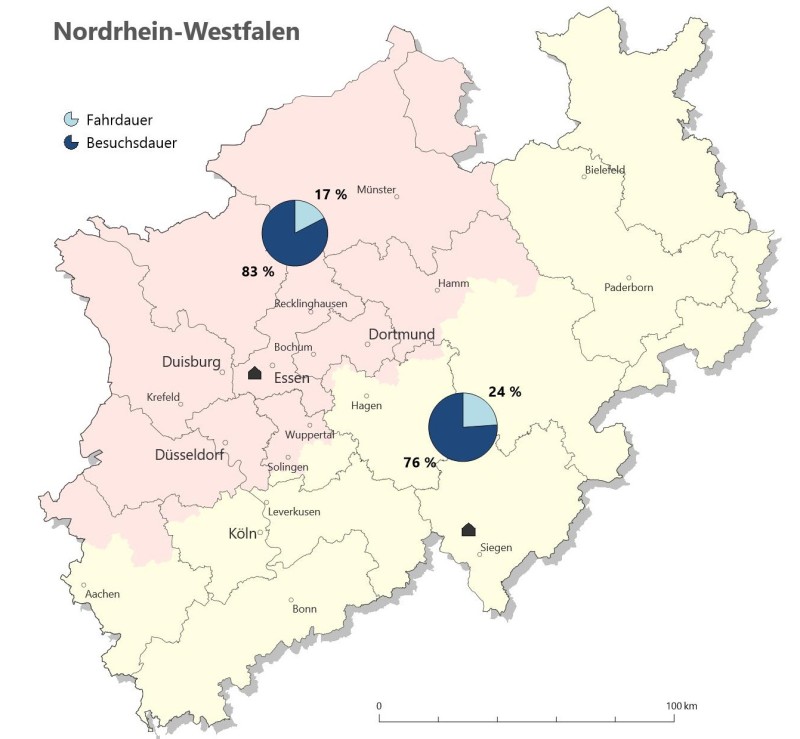
The circle diagrams: enable the comparison of driving and visiting times and thus provide an insight into the utilization of field staff.