Content

|
In the content window you can select which map and which content and analysis should be displayed on the map. |
Maps
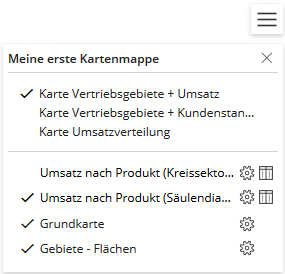
If multiple maps from a easymap map folder are uploaded to easymap explorer, they are selectable in the upper area of the content window. The check mark in front of the map name indicates which map is currently visible. The names of the individual maps as well as the section "Maps and Topics" can be changed during sharing in easymap explorer. If only one map in the map folder has been uploaded in easymap explorer, this section is not visible.
Contents and analyses on the map
Below the map area, all available map layers and analyses of the selected map are displayed. By setting or removing the checkmark in front of the respective layer, you can make the layer visible or invisible. The layers of the map can be rearranged by drag&drop. When you mouse-over a map layer, three dots appear, indicating that you can move this layer by holding down the left mouse button.

|
For the analyses and the base map, after clicking on the Show settings icon the transparency can be adjusted with a slider. |

|
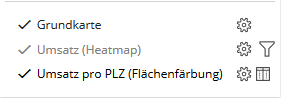
This icon button opens a table for the associated analysis or area surface. In den Tabellen lassen sich Filter setzen und diese auf die Karte anwenden. Mehr zu Tabellen und Filter. |

|
If this button appears next to the layer, you can only filter in this layer. More about filter-without-table. |
If the name of an analysis appears in the list in gray font, this analysis is not visible in the map at the current zoom level. The name of an analysis appears in black letters in the list if the analysis is visible in all zoom levels or as soon as a zoom level is reached by Zoom-In or Zoom-Out in which the analysis becomes visible in the map.
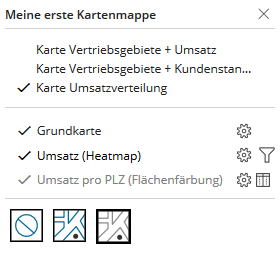
Background maps
Background maps are optionally provided by the map creator. You can choose between different map styles (e.g. street map, aerial photo) or switch off the background map.
reports
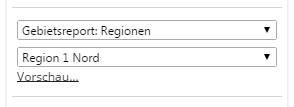
If a workbook contains Reports (e.g. report on regions, filter reports) these are also displayed in the content area. There you can switch between the reports (if there are several) and the individual sheets of the report output.
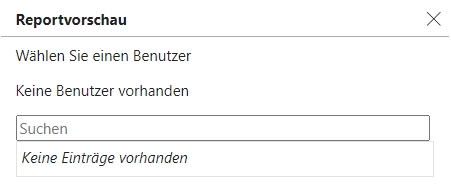
By clicking Preview you can search the list by the name of the field worker and directly see how the user sees the territory, depending on the authorization.
 >
> 
Note: Area reports are usually used in easymap explorer to control permissions in order to allow certain people to view only a certain section of a map. If the map folder contains one or more reports, it depends on your permissions whether you are allowed to open the map folder and which sheets you are allowed to view. The control is done via the reports in easymap and via the report management in easymap explorer (for more information see chapter access-regulations and report-access).
Anyone who has permission to edit a map folder (e.g. the creator) can use the preview to test which part of a map folder will be displayed to a particular viewer within the report.
