Tables and filters

|
In easymap explorer you have several options to display data. In the Topics/Maps area, you can click on the table icon to display tables under the map. Tables are offered for analyses and area surfaces, as long as they contain at least one colored surface. Set filters are displayed via a changed symbol in the view. |

|
The filter icon is displayed if table display is not allowed in the layer, but filtering is possible in the layer. |
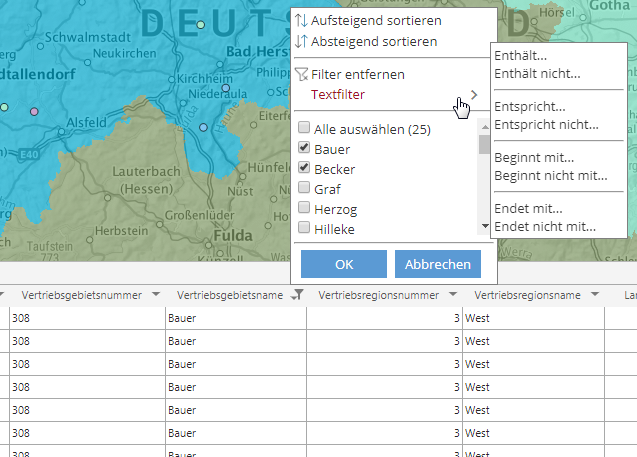
In the table there is a possibility to set a filter over the respective column header.
|
By clicking on the column heading you get to a context menu where you can sort the column in ascending or descending order and call filters. You can set a check mark at the respective column values or remove a value from the selection. In addition, there is the possibility to set user-defined filters. |
|
Export of data and filter functions in the map
The buttons on the left below the table allow exporting the data as an Excel file and activating and deactivating the filters.

|
Download Excel fileAllows you to export the table to Excel. You can export either the whole data of the table or only a filtered part. |

|
Remove table filter: Removes the set filter on the chart. If the filter was also applied to the map, the filtering remains effective in the map until you click Remove filter from cards. |

|
Restore map filter: If the table filter has been removed, but the map filter still exists, you can use this to transfer the map filter back to the table. |

|
Apply filter to map: Applies the filter set in the table to the map plots as well. Please note that this action affects all analyses in the map based on the filtered table. |

|
Remove filter from map: Deactivates the filter in the map display; if the filter was also applied to the table, the filtering remains in effect in the table until you click Remove Table Filter. |

|
Storage of table filterWith this function you have the possibility to save the set table filter locally in the browser. When you open the map folder again, the table filter is restored. |
Filter without table
When sharing, you can allow only one separate filter instead of displaying the tables (with all filter functions).
The filter function is used to filter the content displayed in the map.
How to set a filter:
- Open the Content menu item.
- Click the filter icon for the analysis you want the filter to affect.
Now easymap explorer shows which maps, analyses and tables the filter affects. Note that the filter can affect not only the selected analysis, but also other analyses, because the filter is applied to the table that is the data basis for the selected analysis. However, the same table can be the data basis for other analyses in the same map or in other maps at the same time.
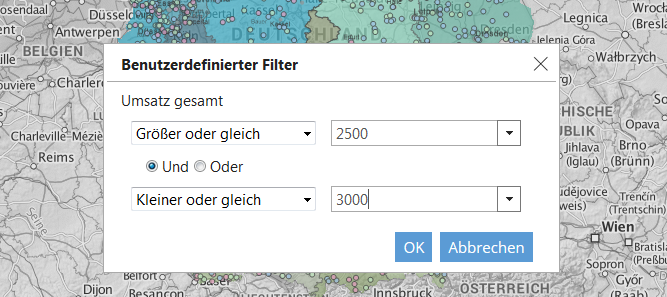
- First, select the column of data to which you want to apply the filter.
- Then select the comparison operator and the comparison value. As an alternative to entering the value, you can select a value from the drop-down menu. Note, however, that there is a maximum of 100 values to choose from at this point.
A second filter expression can optionally be added. This can refer to the same or another column of data in the same table. Both filter expressions can be connected with and or or. Clicking the Apply Filter button activates the filter. The Remove filter button deactivates the filter. After that all data will be displayed again.
Note:
- If the Apply to analyses setting has been deactivated for a table in easymap explorer, this data table will not be offered for filtering in easymap explorer.
- Is already available in easymap If a filter is already set on a table, it will be overwritten when filtering in easymap explorer. When you click Remove filter, the filter specified in easymap set filter is displayed.
- Wenn Sie in easymap If you use automatic calculation of class boundaries in easymap explorer (e.g. equidistant or equally distributed, you should change the value classes to user-defined before releasing them for easymap explorer. Otherwise, the same data may be displayed differently because different filters result in different value ranges for the data.
As long as a filter is activated, a filter icon with a check mark appears in the content selection next to the analyses that the filter affects.
