Tables in easymap
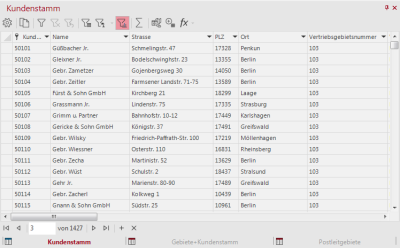
Tables can be opened via the control window Data with a double click on the table name or via the context menu > Show table window. In the standard arrangement 1 the tables are always opened on the right side of the program window.
Tables in easymap are very interactive elements. You get access to the most important functions via the toolbar of the table itself. A context menu by clicking into a table field provides additional access to a variety of functions applicable to this column of the table. The data can be filtered and sorted as desired.
Use the search window in the lower toolbar to browse the tables. Enter your keyword there and confirm it with the enter key. You will jump directly to the first hit. By pressing Enter again, you will jump to your next hit.
Depending on Tabletype the toolbar of the table view offers different functions:
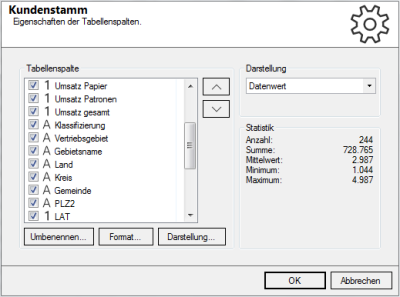
The Properties command can be used to change column settings for the current table. Here you can remove columns from the view by removing the checkmark in front of the respective column. You can also adjust the order of the columns individually by using the two arrow keys; a multiselection with the Ctrl key is possible.
- With the button rename you can change the display name of the column in easymap. This also works for linked tables, the names are not written back to the linked original application file.
- For columns of numbers, you can also change the Format for the display in the table and map (e.g. number of decimal places, currency and percentage). The accuracy of the original data is not changed by this setting. It is not possible to turn a number into a key or a text.
- Click Display to change the color and font of a column in the table. You can change the appearance of the data cells and the header line separately.
- In the Display area on the right, you can select between Data value, Bars with data value (in relation to the other cells in this column) and Bars without data value for columns of the data type Number. Bars for positive numbers are drawn in blue and bars for negative numbers in red and cannot be changed individually. For columns with the data type Text you can choose between Data value or Color.
- In the Statistics area, you will find an informative overview of statistical key figures for the selected column.
Note:
-
The representations set here are also used for table objects and for the data display in the easymap explorer.
- When displaying the column as a color, it is important that the selected column already has a color value.
-
Usually the color values for result tables or tables of the territory structure can be converted so that they display the column with HTML color values as a color field or as a value at - e.g. or #33CCCC.
With Queries you can compile data from one or more tables.
This allows you to copy your selection to the clipboard. If you hold down the Shift key while clicking on the symbol, all values with formatting are copied to the clipboard.
| Edit filter |
Here you can see whether a filter is active. Another click on the button allows you to extend the filter. Then the window "Filter table" will be opened to edit the filter criteria. In the dialog window Filter table you are able to compile your own criteria for the filter. All calculation rules for the calculated columns are available here. Note: Only useful if a coupling to a level is available. |
| Remove filter | Cancels the filter settings. |
| Previous Filter | Adjusts the last set filter. |
| Filter modified |
This filter can only be found for tables that are created in the territory organization (in the DistrictManager Edition). If changes are made in the territory organization, you can use this filter to display the changes. Filter Last Changed shows you only the records that were affected by the last change. |
|
Filter Selected |
Only useful if a coupling to a level is available. When activated: This filter only shows records of elements that are marked in the map window. The corresponding areas are determined based on links. |
|
Filter by clip map |
Only useful if a coupling to a level is available. Falls Enabled: The table displays only records for elements that are visible according to the clip map. The corresponding areas are determined via the coupling. In addition, the pop-up area can be used to influence the layer used: Automatic: The standard logic of the connection is used. In case of several connections easymap chooses a suitable level for the connection. Setting a specific layer: The clip map of this layer is used for the filter. |
|
Apply filter to analysis |
Determines whether a filter should also affect analyses and table objects. Activated: The filter is also applied to analyses and table objects so that they only show partial results. Individual analyses can be excluded by selecting Ignore filter from the analysis context menu. Deactivated: Analyses and table objects always work on the entire table. If a filter is set, this only affects the display within the table window. Note: If you set the classification of your analysis to User-Defined, the classification settings for each value class are retained, even if some classes are omitted by a filter. |
The symbol button Show Sum displays a row at the top of the table containing the total of the respective column. The sum is only calculated for columns that are formatted as numbers. If the command is executed again, the row is hidden again. (available in the context menu of External Data, Queries, Geographic Data, and Analysis Results)
Coupling a table and a map results in a mouse click in the map marking the corresponding rows in the coupled table, while a mouse click in the table marks the corresponding object in the coupled map.
Further information and instructions on how to pair data with the map can be found here - Couple table and map.
If there is a marker in the table (whether one row or more), this marker can be displayed in the map. If you click on the Zoom button on Marked, the map zooms exactly into the area.
This function allows you to add your own calculated columns. Settings and possibilities of the calculations can be found here.
Additional filter and sort options in the tables
A click on the column heading opens a context menu in which you can sort the column in ascending or descending order, view the statistics for this column or call up further filters - more about filters and sorting of data tables.


