Connect Table and Map
The command Connect table and map is located in the menu Extras as well as in the symbol buttons in the tabels itself. The user chooses a table and a certain layer of a map base, which are to be coupled with each other. In addition, he specifies a column from the table via which the coupling is to take place. This column must contain the number of the elements in the selected map layer.
The following 3 components are required for a link:
- Table - A table that is involved in the linkage.
- Column - A column in this table that is compared with the area numbers of the level (henceforth referred to as the matching column).
- Layer - A layer (whereby no layer objects are used here, but are linked to all structurally identical layers).
Display of linking errors
The connection allows you to quickly determine whether all your data can be displayed on the map you have selected. In front of all rows that have a faulty connection because the matching column contains a value for which there is no element in the map. A red error symbol is then placed here as a marker in the rows of the tables.
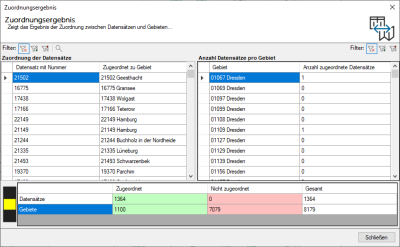
In the assignment statistics you can directly filter and view a summary of the unassigned data.
In the "Assignment Result" dialog, all data records from the tables are checked, but not in the "Link Table and Map" dialog. Therefore, there may be differences here, where the traffic light color for the linkage appears green in the first dialog box, although the assignment result remains yellow.
Mode of operation of a link
Now when your table is connected to the map, the following things will become visible:
- When you move the mouse over the individual lines of the table, the corresponding areas in the map are highlighted in yellow.
- If you select one or more rows in the table (with the CTRL or SHIFT key pressed), the corresponding areas in the map will be selected. If you then use the command Zoom to selection in the toolbar of the table, the map is zoomed to the selected area.
- If you mark areas (the plane from the link) in the map, all matching rows from the coupled table are marked red. Then use the command Filter marked in the toolbar of the table to display only the marked data records in the table. These rows can be copied to other programs with the command Copy selection to clipboard in the toolbar of the table.
Internal data are automatically linked
Internal data (geographical data, analysis results and basic data of an territory organization) are always automatically linked to the corresponding map layer. If, for example, you have opened the table for the area text level, a click on an area text in the map marks the relevant line in the table. There you can change the text or the font, for example. If you click on an area text in the table, the corresponding text will also be marked in the map.
Special links for levels of territory organization
By setting up a connection, a marker forwarding between district levels created in the territory organization is achieved, i.e. clicking on a district (table or map) leads to the selection of all contained and superordinate territory in the corresponding tables.


