
Territory Organization on Customer Points
In this workbook we show you how easy it is to create a territory structure with your customers' locations. In addition, analyses are presented that specifically evaluate these territory structures. The special feature of customers with the same items is explained using an example. An attractively designed sheet shows you how to prepare information for dissemination and presentation of the results.
The workbook contains the following sheets:
- Planning on a customer basis
- Customers in the same position
- Territory analyses
- Export sheet with report
Planning on a customer basis
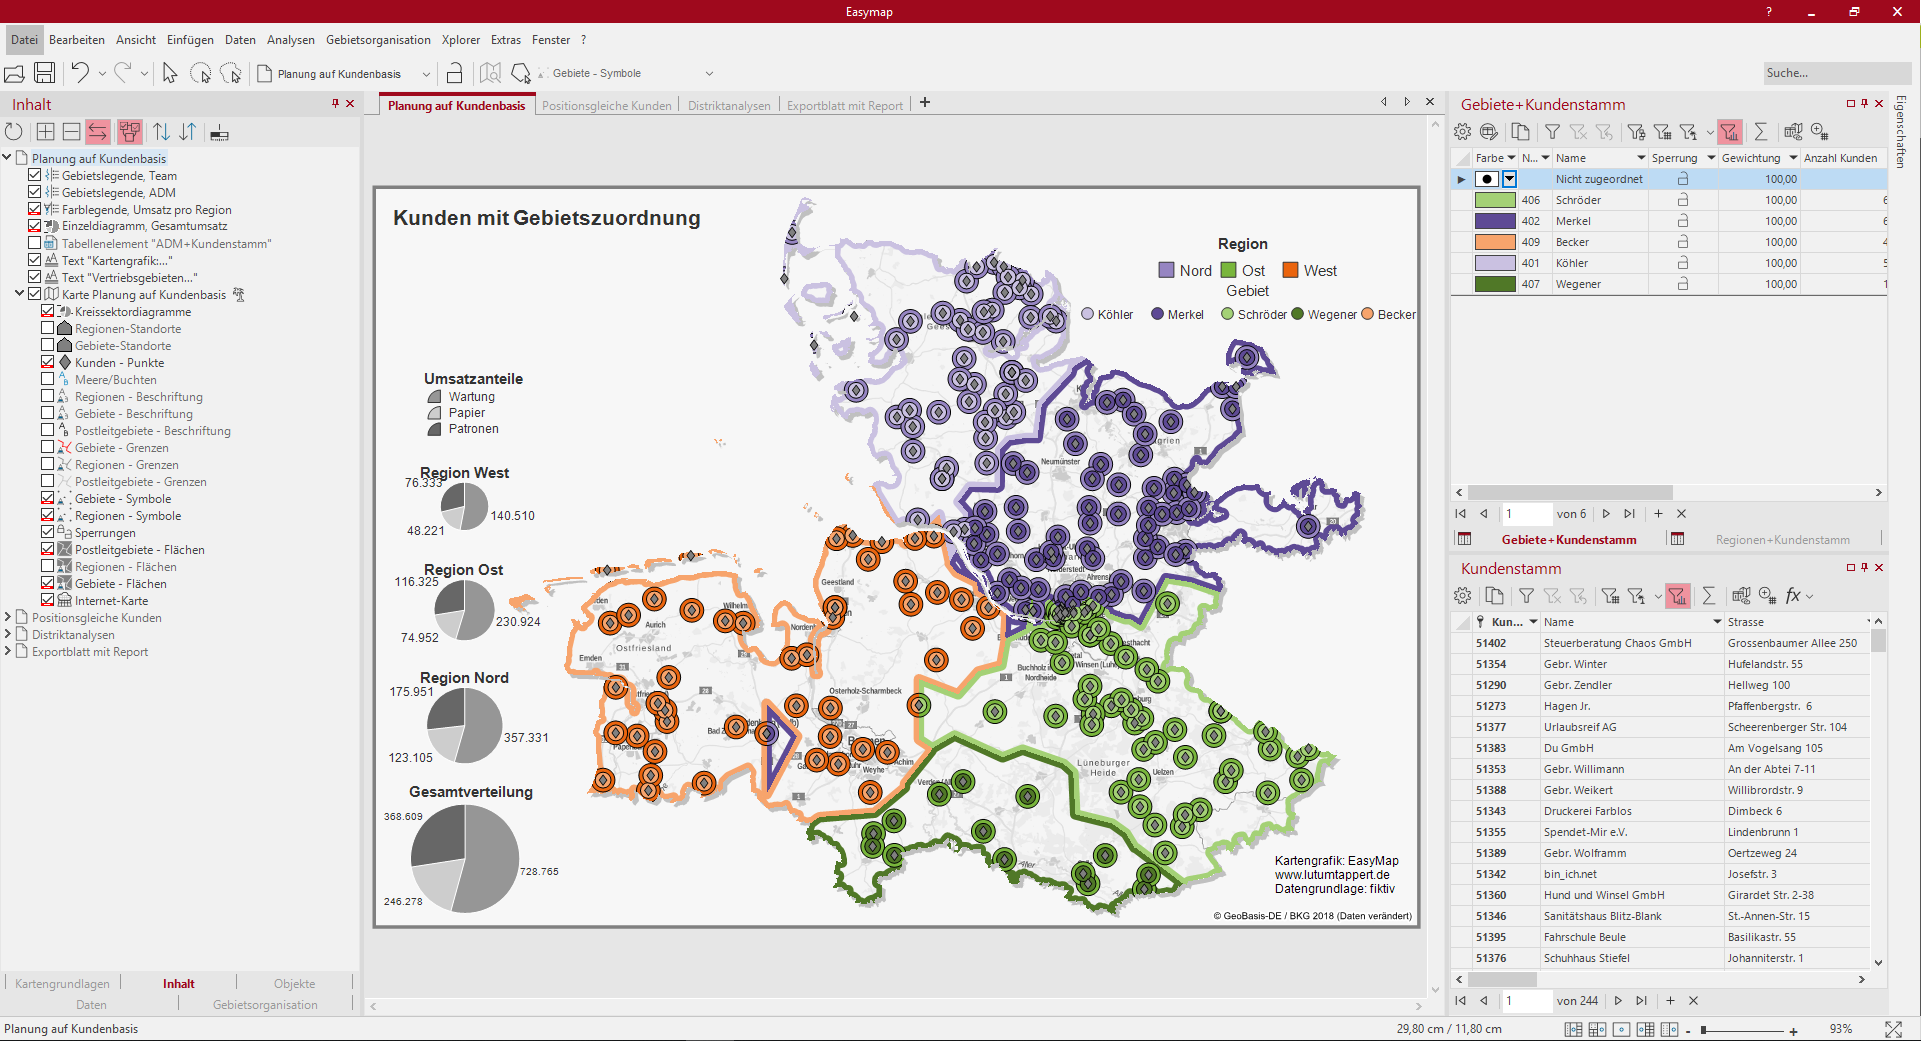
On this sheet you can see a territory structure based on the addresses of your customers. The customers are displayed as green diamonds on the map. The coloured circles indicate the assignment to the respective areas and regions. The colouring of the areas is set hierarchically to the superior regions, so that a simple visual allocation of areas to the regions is possible. The Legenden for the areas and regions at the top right of the sheet also reflect the area hierarchy through their arrangement. In the control window content you can display the locations of the areas and regions by checking the checkboxes.
For each region there is a circle sector diagram positioned outside the region. A single diagram stands for the distribution of sales in maintenance, paper and cartridges.
For better readability of the map a Internet map has been used instead of the topographic layers of the base map.
So you can recreate this map:
- Planning Mode and create a Create new point layer with the help of the wizard, select the "Customer base" table and locate the customers on the map using the Placement by geographical coordinates.
- Wizards Create new territory structure and as brick level select the level of customer created in the previous step, then create two superordinate levels for areas and regions.
- Create locationseach for the areas and regions in a separate step.
- Area Legends for areas and regions, set the number of areas or regions in the properties for Number of columns accordingly.
- Analysis Circle sector diagram based on the level "Regions - Areas", table "Regions+Customer Base" with three Segments for the data columns "Sales Maintenance", "Sales Paper" and "Sales Cartridges", the diagrams place by Drag&Drop outside the regions and align.
- Stand-alone Chart on the basis of the circle sector diagrams and also position them below the other diagrams.
- Insert a Internet map and select the "BKG WebAtlasDE.light" in grayscale.
The following tables were used:
- regular clientele
- Regions+Customer base
Customers in the same position
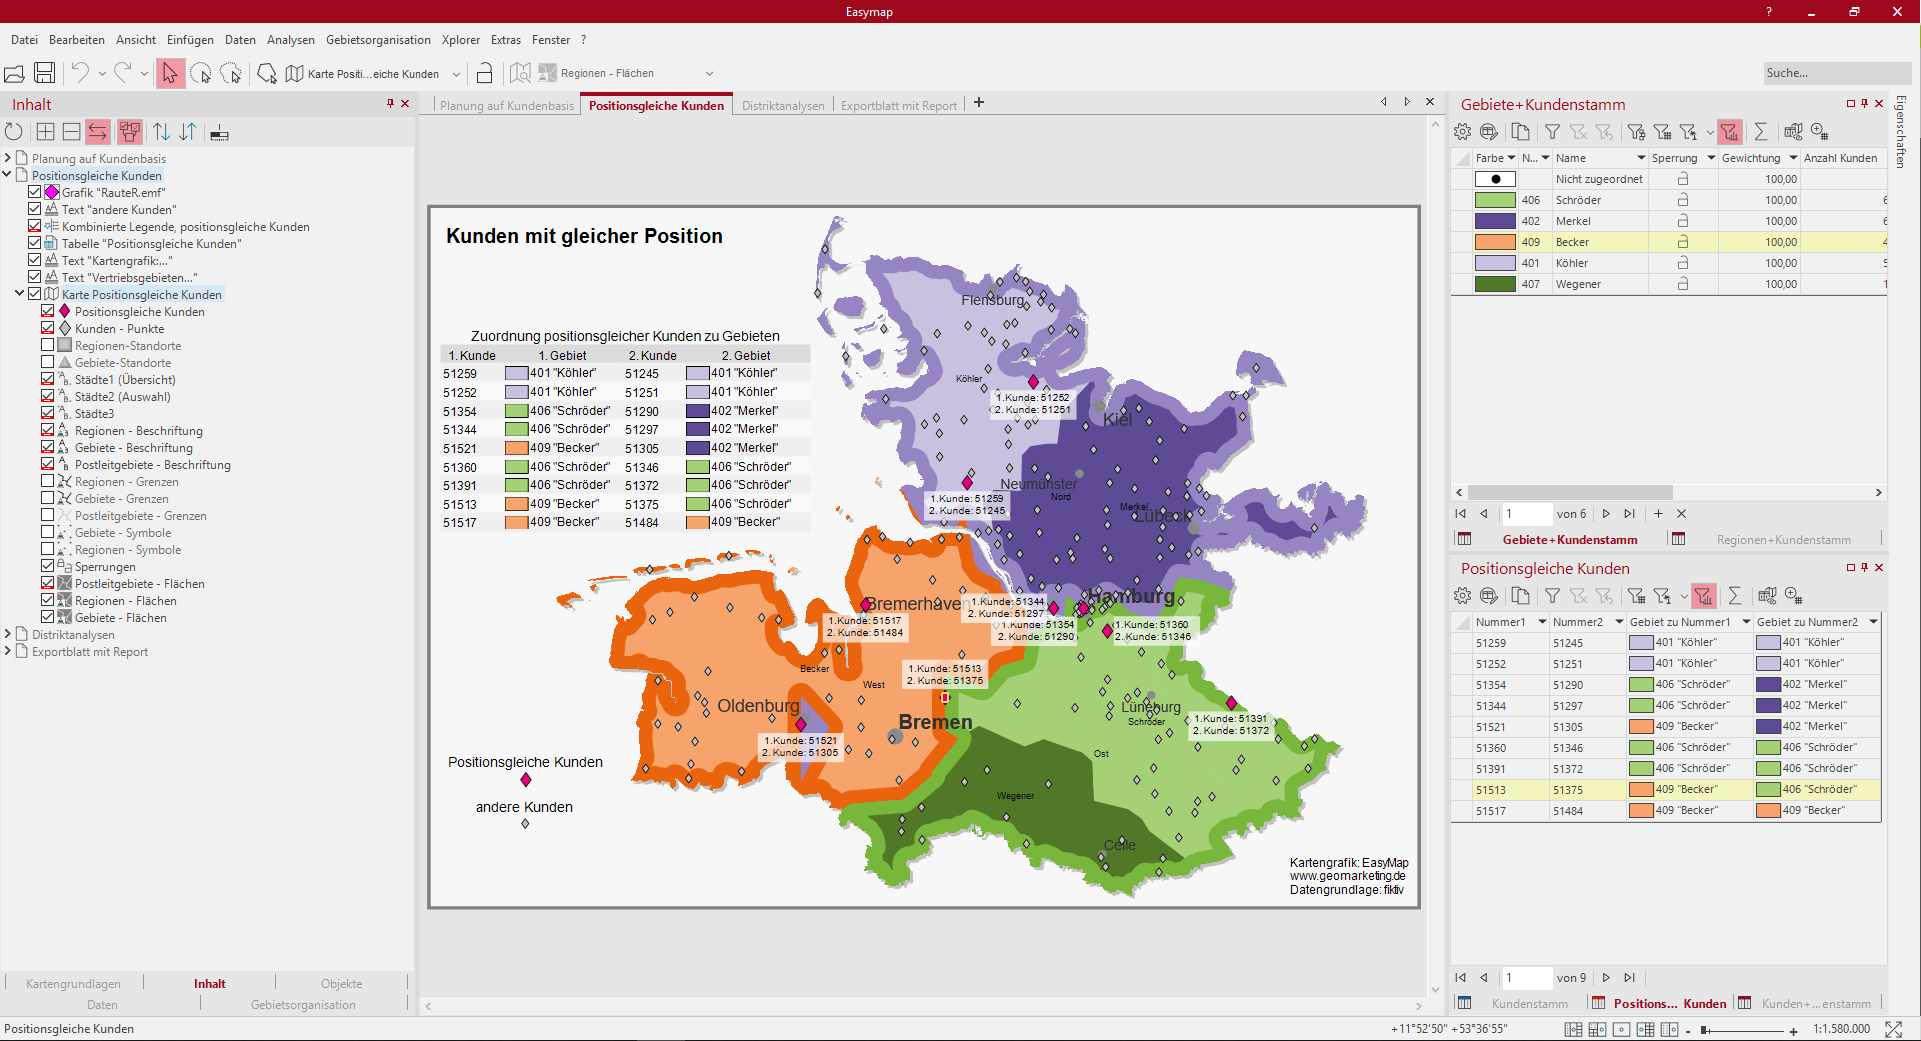
If customer locations are used as the basis for a territory structure and these are positioned via geographical coordinates, then it can occasionally happen that there are customers with the same position. This is not possible with positioning via postal codes. In reality, this can be a medical centre, for example, and the doctors to be visited sit on different floors. These special customers are represented on the map with a pink diamond. The customer numbers of the customers with the same items serve as inscriptions.
The command Same position customers is a query that determines the elements with exactly the same position. The result is then displayed in a table in which you can view the query structure. You also have the option of inserting customer points with the same position as symbols on the map.
The table object next to the map makes it clear again that these customers are partly looked after by different sales representatives (level areas) and can also be located in different regions (recognisable by the colours).
A Combined legend has been inserted for customers with the same position. The explanation of the remaining customers takes place over a Text and a Graphic.
In order not to make the contents of the map too confusing, some topographic levels such as rivers or roads have been omitted from this sheet.
So you can recreate this map:
- Insert layers areas and areaslocations as well as regions and regionlocations from the control window areaorganisation.
- In the control window Territory organization, activate the context menu command Edit > Show same position customers, Show as analysis for the level "Customers".
- Combined Legend for customers with the same items.
- Image and Text for the explanation of the other customers insert and align align.
- table object for the table "Customers with identical items" and format it attractively.
- Text box for header and footer.
The following tables were used:
- regular clientele
- Customers in the same position
Territory analyses
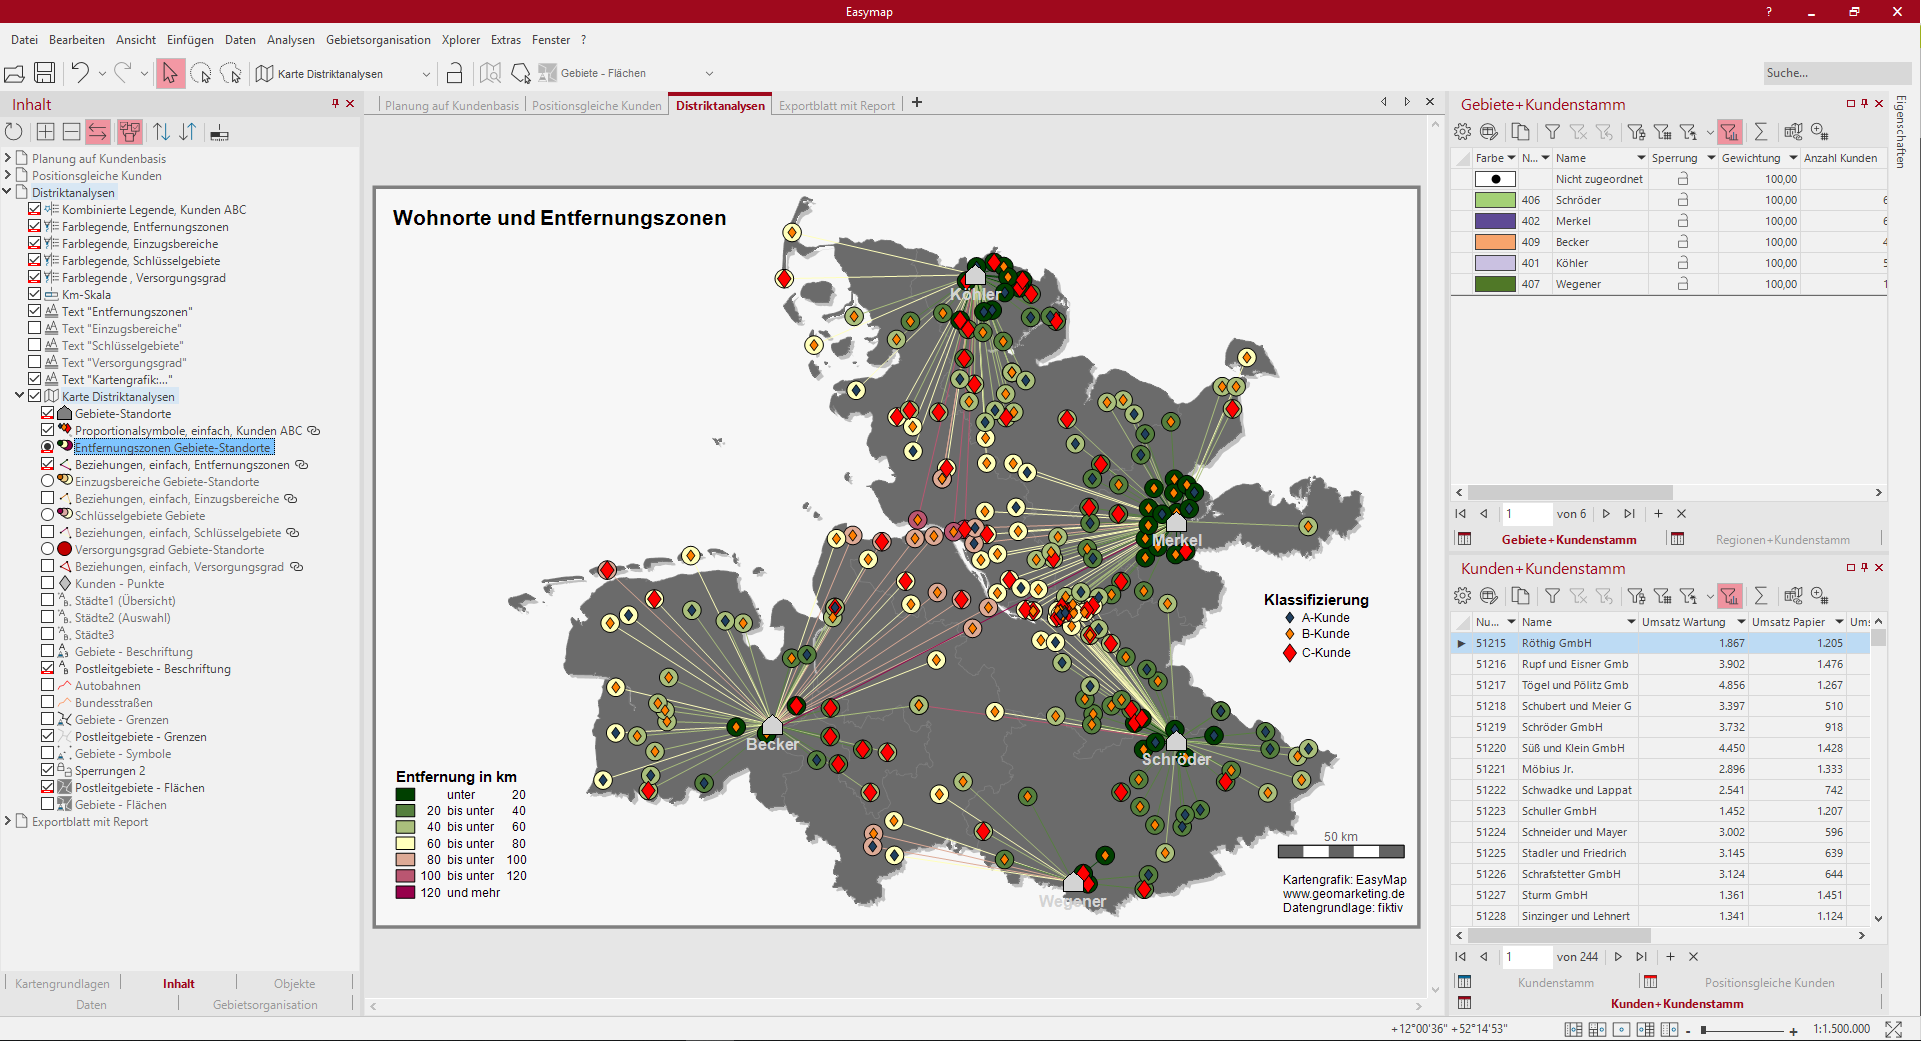
On this sheet you can see the four different analyses: Distance zones, Catchment areas, Key areas and Coverage level based on customer level. In addition, the area locations are shown with a grey house. The analyses are created via the control window Territory organization in the context menu of the levels. A suitable Color legend can always be seen to explain the analysis. So that you can better estimate the distances on the map, a Scale has been added at the bottom right.
Via the control window Content you can switch between the individual analyses by clicking on the round radio buttons. The analyses belong to a mutual visibility group, so that only one analysis is visible at a time. The legends and the headings change automatically as well, since they are suitable for the respective analysis in a Simultaneous visibility group. The symbols for the locations of the customers can also be made visible on the map.
So you can recreate this map:
- From the existing territory structure drag the levels of customers, territory and territory locations from the control window Territory organization onto the sheet.
- Select analysis distance zones in the layer context menu area locations, keep settings column and colors class are user defined classified (7 zones with 20 km width).
- Select the analysis Catchment areas in the context menu of the level Territories, set the property Calculation with Comparability of territories to Territory-related evaluation (percentage), set the data column to "Total sales", retain the settings of the color and the classes.
- Select the analysis key areas in the context menu of the level citecustomers, set the property Calculation with comparability of territories to territory-related evaluation (percentage), set the data column to "Total sales", keep the settings of the color and the classes.
- Selection of analysis Coverage in the context menu of the layer Territories, set the property Calculation of Capacity to "50" and select as column Distance to location, keep colors and classes.
- Insert a Color legend for each analysis.
- Text box for the heading for each analysis.
- Simultaneous visibility group for each analysis with the corresponding heading, the legend is already linked internally with the analysis.
- Alternating visibility group for the analyses so that only one analysis with the explanations is visible at a time.
- Select the analysis symbols with the settings: Analysis first couple, select the column "Classification" and classify according to feature, determine symbol, color and size for the respective feature.
- Combined Legend for the analysis Insert symbols.
- Scale and free hand graphics for further designs.
- Group for the individual territory analyses and move one heading, one legend and one histogram each.
The following tables were used:
- regular clientele
- Customers+customer base
Export sheet with report

This sheet shows you an optimized representation of a map with Report for exports to other formats, such as image files or Office formats. To view the report, right-click Area report: Regions in the control window Content and select Display report preview from the context menu.
On the map the customers, areas - areas as well as the area locations and region locations are visible. The A customers are visible as symbol analysis in the form of pink stars, all other customers are visible as green diamonds.
In addition, the sheet was supplemented with three table objects, which adapt themselves accordingly in the report. In the lower part of the sheet you will also find a small inset map, which always highlights the section on the map where the region is located on the overall map. The individual chart to the right shows the distribution of customers in the ABC customer classification for each region.
So you can recreate this map:
- Drag the level "Areas" and "Area locations" of the Territory structure from the control window Area organisation onto the map.
- Selection of the analysis symbols, setting: Analysis first couple, selection of the column "Classification" according to feature, delete classes for B- and C-customers - the classification changes to user-defined, adjust color and size.
- Report on regions create, controlling plane: "regions - areas", set output details, link data.
- Report heading 1 by setting own texts around the macro for {Report.ElementName} {Report.CurrentName}.
- Stand-alone Chart for the table "Territories+Customers" and select three columns A-, B- and C-Customers, set the colors to no fill.
- Image and Text as legend for the locations of territories, regions and A customers.
- Inset Map and make the settings according to our tips and tricks Report with inset map.
- table object for the table "Regions+Customer Base" and reduce to the columns with "Sales Maintenance", "Sales Paper", "Sales Cartridges" and "Total", since Filter according to clip map is set in the table object, only the data from the displayed region is shown.
- table object for the "Customer Master" table and expand the filter expression via Edit Filter: Visible and [Classification] = "A Customer", so that only the A customers in the table per region are displayed.
- As Graphic add a company logo and move it to the desired position.
- For an optical grouping of the individual objects in the map, insert a group. To do this, set the color of the frame to a subtle gray in the properties of the group. Then move the other objects.
The following tables were used:
- regular clientele
- Regions+Customer base
