Grid
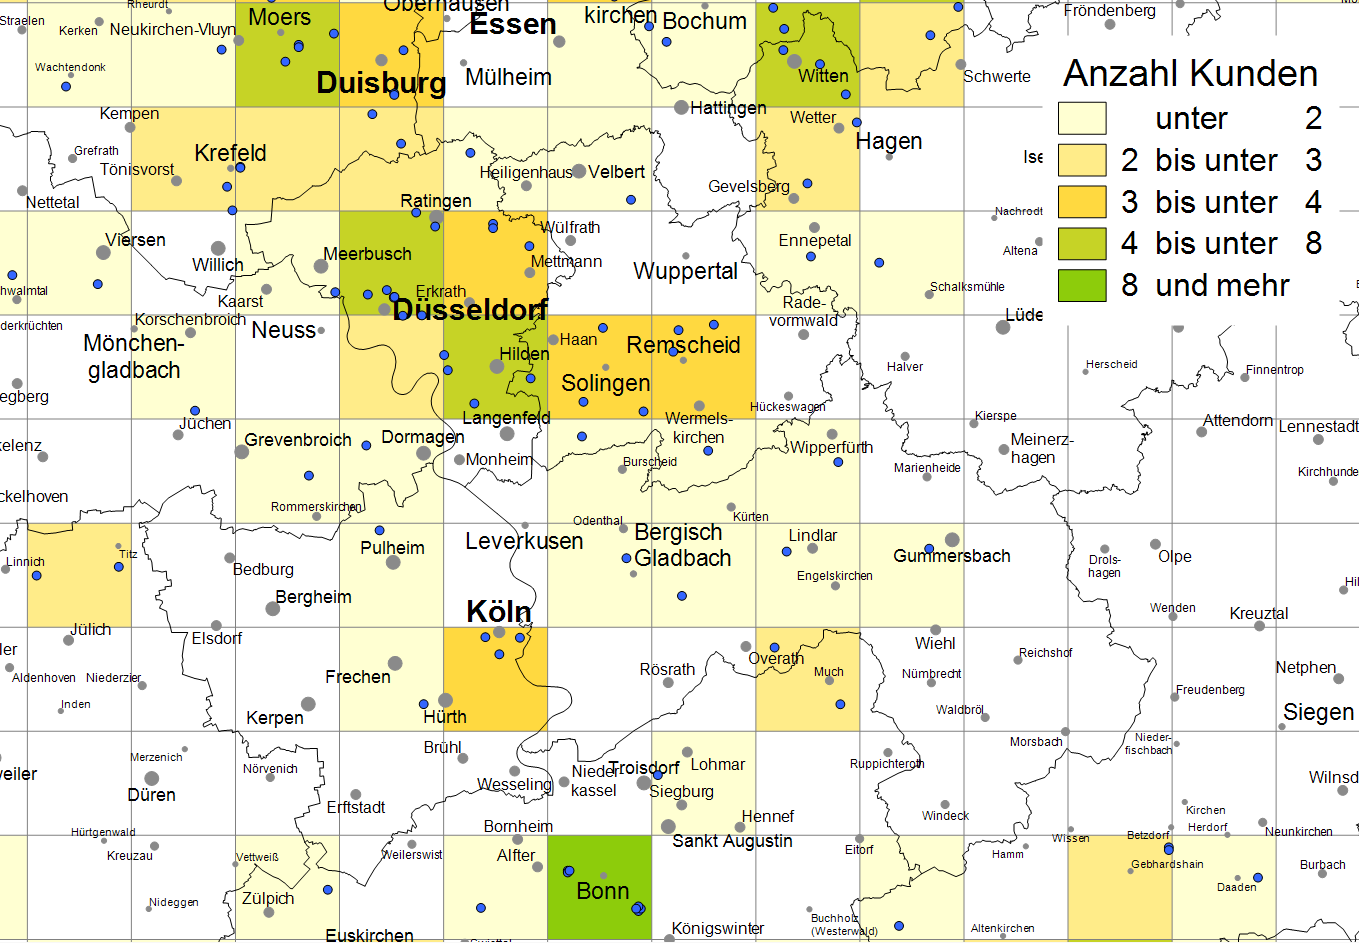
With the command raster easymap offers the possibility to display location-related information (e.g. turnover of individual branches) on the map via a grid. For this purpose, the values of a specific data column of all locations located in a raster cell are aggregated and the raster cells are colored depending on the values. To insert a raster, drag the corresponding data column from the control window Data via Drag&Drop onto the map.
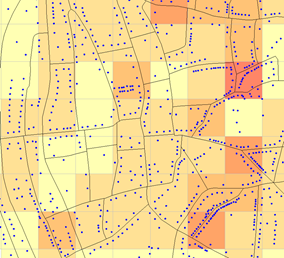
Figure: Address distribution in the city centre
Data input
First, link the table with the selected base map. Select whether you want to place the locations by Areas or Addresses or Geographic Coordinates. Please find more information on placement types here.
Set Properties of the Analysis
After selecting the data basis, you can select the data column in the area grid colors after which the screen cells are to be colored in the next step.
Note: You can also insert your analysis via the menu bar Analyze. You get an analysis without predefined settings and value classes.
- What does the assignment result tell you?
- Would you like to place your data on the map using geographical coordinates? So the The Data Input for an Analysis.
- The Advanced button allows you to specify whether the analysis should consider an existing clip map when calculating classifications - more on the analysis reference.
Grid Colors
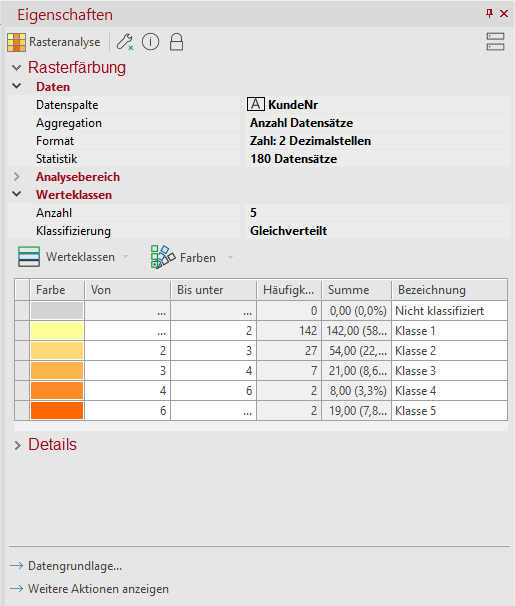
The aggregation of the selected column determines how the data that falls into a grid cell is aggregated. If, for example, customers are to be counted in a grid cell, set the aggregation to number records. You can find more information on the various aggregation options here.
There are numerous classification options available for the coloring of grid cells. Besides the count of classes, you may specify how the boundary values are set. The colors of each class can be set individually or via a color gradient. Individual colors for each class can also be set automatically clicking Colors > Generate Random Colors.
For more information on editing classes, symbols, colors and sizes, see here.
Grid properties
First properties of the grid can be edited directly in the map view. By clicking on a grid cell, for example, you can influence the grid size (by zooming in or out of the cell) and the origin of the grid (by moving the selected grid cell). This can be useful if a certain area (e.g. the center of a city) should lie as completely as possible within a raster cell.
These and other properties of the raster grid can be found in the Details area and adjusted even more precisely. Besides the width, you can adjust the color of the grid frame or set the origin of the grid more precisely by specifying X and Y coordinates.
| Visibility | |
| General |
Here you can control the visibility of objects and elements. |
| Scale range |
Here you can set whether the selected object or plane should be visible at each scale. Or you can specify the scale or zoom level at which the object or layer is visible. |
| In reports |
In Reports there is the possibility to change the environment only partially to zeigen. You can use this property to specify whether the layer is also visible outside the report area in this case. |
| Alternating visibility group |
Set a group for mutual visibility here. If the element is to be made equally visible with other elements, you must use the same name for the visibility group. |
| Simultaneous visibility group |
Set a group for simultaneous visibility here. If the element is to be made mutually visible with other elements, you must use the same name for the visibility group. |
| Grid Cells | |
| Width/Height | Enter the desired width and height of the grid cells here. |
| Number of Horizontal/Vertical Cells | Enter here how many cells should be placed in horizontal and vertical order. |
| Origin | |
| Latitude (LAT) / Longitude (LON) | Here you can define the origin of the grid. Normally the origin is at the top left. The information is given in geographical latitudes and longitudes. |
| Common | |
| Comment | Enter here a comment for the display of the workbook in EasyMap Xplorer. The comment is also displayed in EasyMap as a tooltip in the control window Contents. |
| Style | |
| Line Color | Select here the color of the displayed lines. |
The commands of the context menu
You can call up its context menu by right-clicking on the analysis in the control window contents. The context menu offers actions that can be performed on this analysis.
| Transfer Selection to |
Transfers the current selection geographically to another object. Details... |
| Visible |
Shows whether the object is visible and allows switching the visibility. |
| Order |
Here you can change the selected element in the character sequence. Another option is to drag and drop the selected element within the content view. |
| Input Data... |
Displays the data settings for the selected analysis. You can use this command later to change the connection between the analysis and the data. Further information can be found here. |
| Show Results Table | Displays the results of the selected analysis in a table. |
| Ignore filter |
Defines whether an Analysis filter should be considered or not. |
| Clip Map |
Here you can define a different clip map for the analysis. |
| Map XY |
Here you will find various commands for the map. |
| Copy |
Copy the object (if necessary with all subobjects) to the clipboard to paste it elsewhere. The object can be inserted in other applications as a graphic, or inserted in EasyMap as a copy of this object using the Insert command. |
| Paste |
Pastes the contents of the clipboard into this object as a child object. |
| Delete | Deletes the selected element. (See also: delete objects) |
|
Rename |
Changes the content view to an edit mode to give the object a new name. (This can also be achieved by clicking on an object that has already been marked.) |
| Properties... |
Opens a properties dialog in which you can edit the Properties of the selected object. If several objects are selected, many properties can also be changed simultaneously for these objects. |
