
My first Workbook
This workbook contains its own territory organization with data. In addition to the territory organization, you can try out various analyses and functions.
The workbook contains the following sheets:
Sales territories + sales
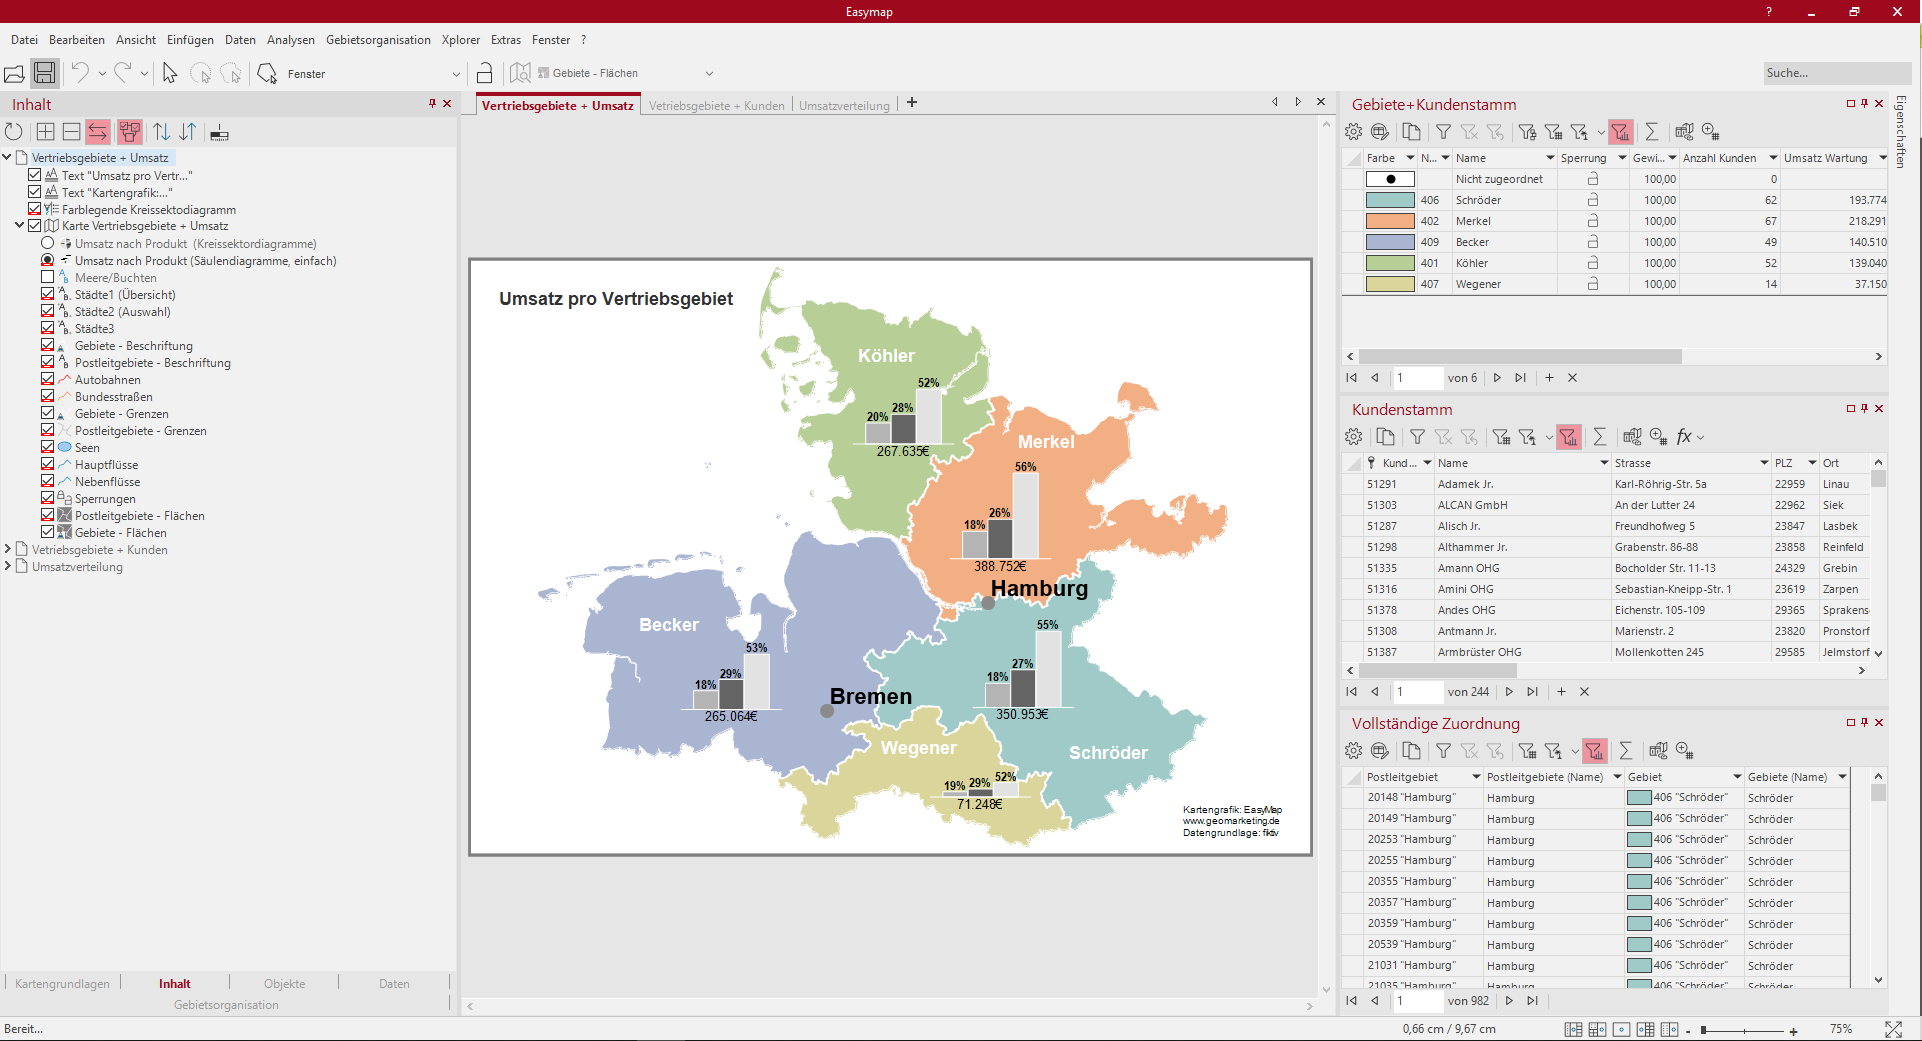
On this sheet you can see the areas (Areas - Areas) of five employees, each displayed in a different color. The areas are marked with the names of the employees in white letters (areas - marking).
In addition, you can see a bar chart (Sales by product (bar charts, simple)) for each area, showing sales by different product groups Maintenance, Paper and Cartridges. The diagrams are labeled with the total turnover per sales territory below the columns. Each column also shows the percentage distribution of sales to the individual product groups.
Via the control window content you can switch between the analyses bar chart (sales by product (bar charts, simple)) and circle sector chart (sales by product (circle sector charts)) by marking one of the radio buttons. By mutual visibility only one of the two diagrams is always visible.
In the data window on the right you can see three tables. The top table (areas + customer base) contains the individual areas with color, number and name and additional data columns from the middle table (customer base). The middle table "Customer master" was initially used to set up the territory structure. In addition, sales have been aggregated to the upper table so that the two charts show sales per product and territory. The table below (Complete allocation) shows a complete allocation of all postal codes to the corresponding areas.
So you can recreate this map:
- Territory structure with the table "Customer master".
- In the "Areas" table, use the icon Edit query... to append the "Customer master" table.
- Change area colors in the "Areas+Customer Base" table by clicking on the color field.
- Properties of the Areas - Customize Label: in the area Label set the Font to "Arial (18 pt)", Font color to white. If necessary, reposition individual labels on the map using Drag&Drop.
- Analysis Insert column chart: Select the table "Territories + customer base", three Segments for the data columns "Maintenance sales", "Paper sales" and "Cartridge sales", Color set to gray tones. In the Details: Width to 0.7 cm, Sorting Ascending, Data Labeling: content in percent, font on Arial Narrow (10 pt), formatting 0 decimal places, edge color white, diagram text: via Text macros select the table column "total sales" and aggregation "total", set position of label below.
- Analysis Insert circle sector diagrams: Select the table "Territories + customer base", three Segments for the data columns "Maintenance sales", "Paper sales" and "Cartridge sales", Color set to gray tones. In the Details: Sorting Ascending, Data Labeling: content in percent, font on Arial Narrow (10 pt), formatting 0 decimal places, edge color white, diagram text: via Text macros select Table column "Total sales" and Aggregation "Total", Position of label set above.
- Color Legend for the two analyses.
- For the two analyses in a Create mutual visibility group.
- Text box for heading and footnote.
The following tables were used:
- regular clientele
- Territories+Customers
Sales territories + customers
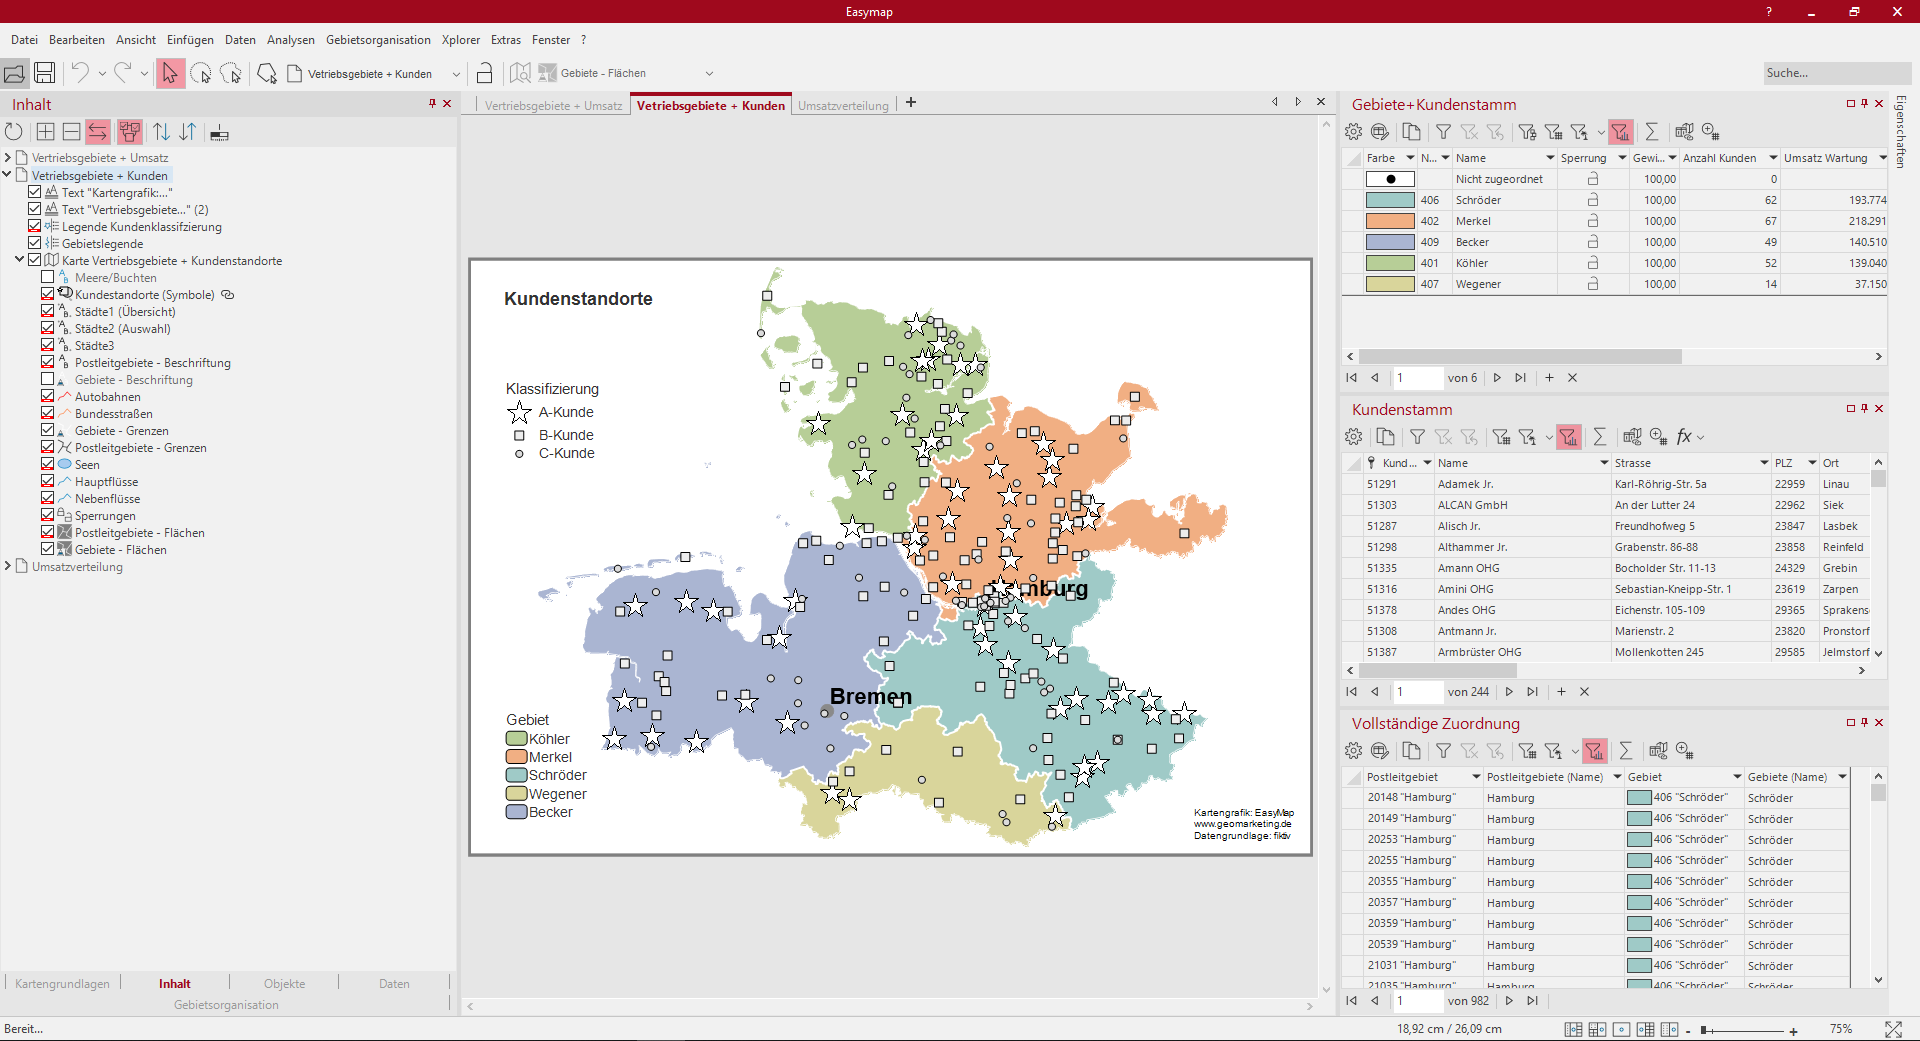
On this sheet the same area representation is selected as on the first sheet (sales areas + turnover). The areas are not labeled in the map here, but a area legend was added to the bottom left of the sheet.
The customer locations are represented as symbol analysis (customer locations (symbols)) on the basis of a classification A customer, B customer and C customer. This analysis was generated with the middle table (customer master).
In the data window on the right you can see three tables. The top table (areas + customer base) contains the individual areas with color, number and name and additional data columns from the middle table (customer base). The middle table "Customer master" was initially used to set up the territory structure. The table below (Complete allocation) shows a complete allocation of all postal codes to the corresponding areas.
So you can recreate this map:
- Territory structure initialize with table Customer base.
- In the "Areas" table, use the icon Edit query... to append the "Customer master" table.
- Change area colors in the "Areas+Customer Base" table by clicking on the color field.
- Layer Areas - Labeling in the control window Content set to not visible.
- Area Legend to the Insert Territories layer.
- Analysis Icons on the Customer Master table with an ABC classification and adjust the color, shape, and size.
- Text box for headline and footnote.
The following tables were used:
- regular clientele
- Territories+Customers
turnover distribution
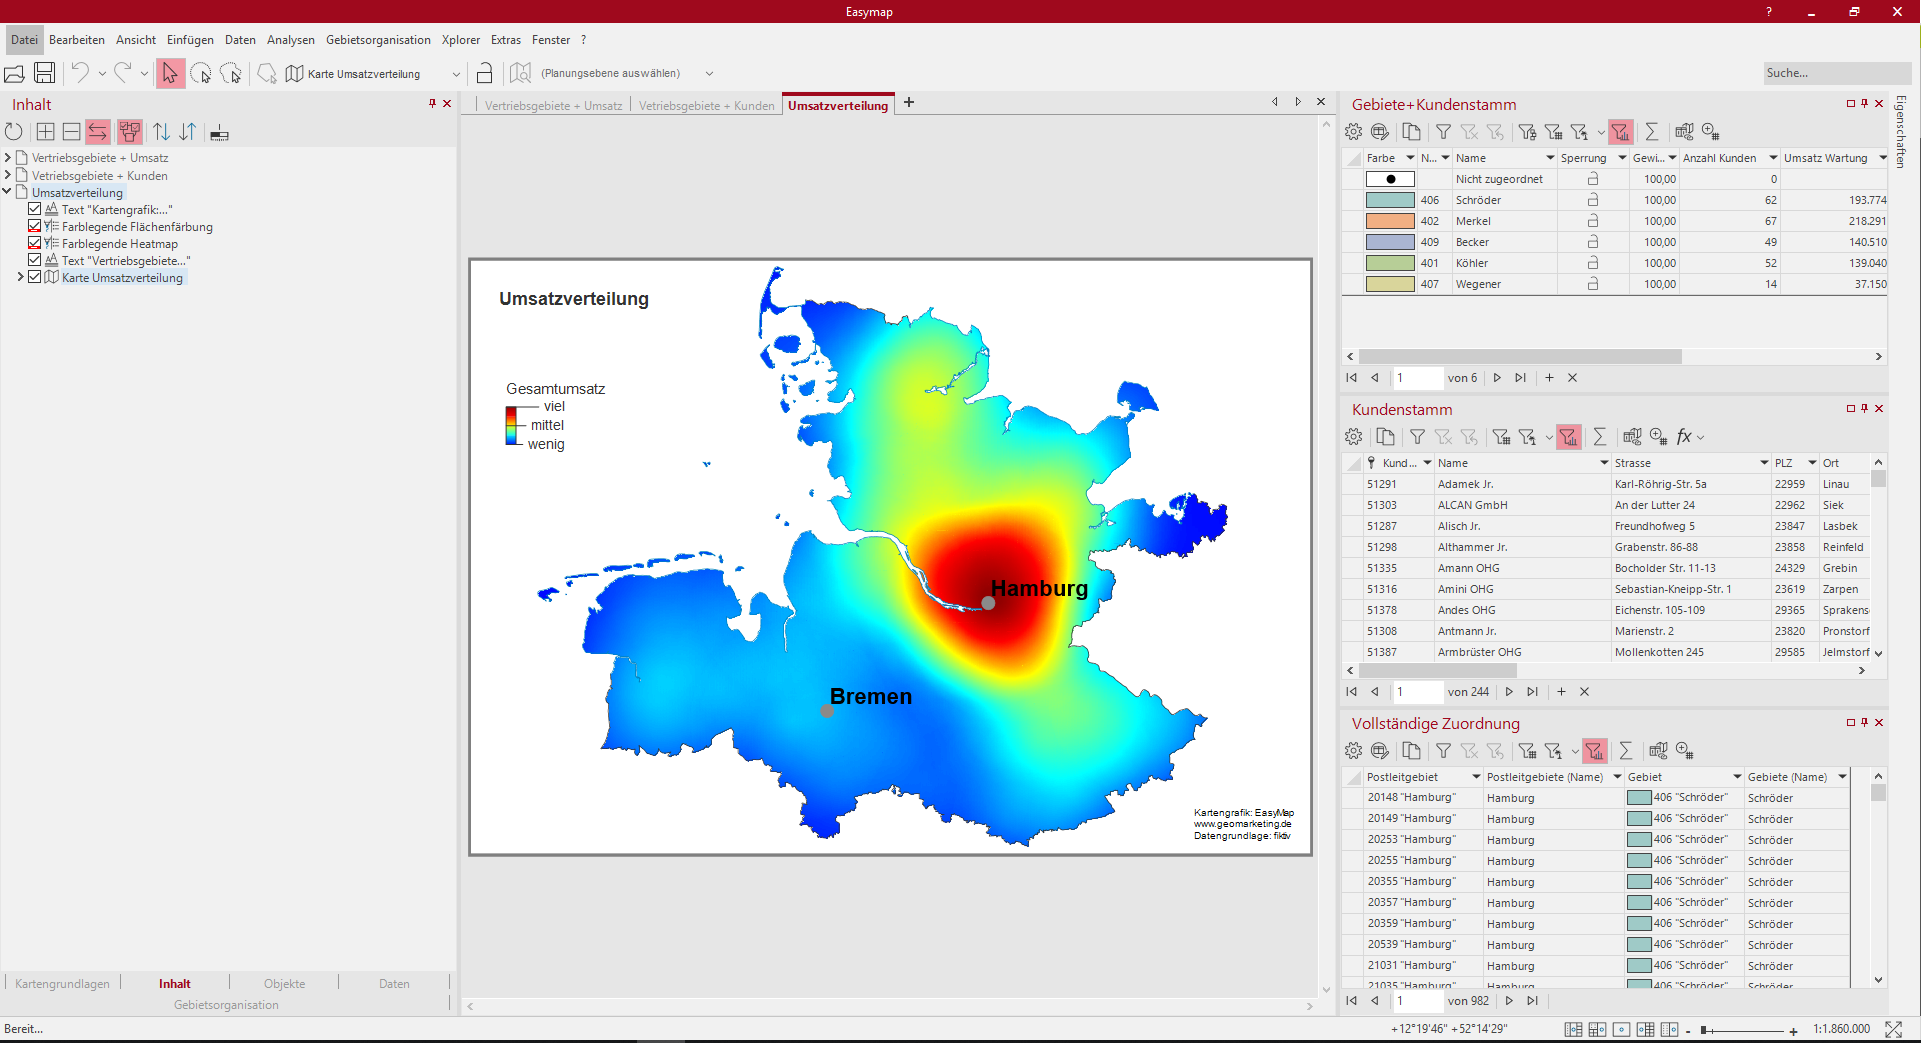
On the sheet Sales distribution you can see the Sales (Heatmap) as a thermal image map. Areas with intensive red coloration show a high spatial concentration of sales, whereas areas with intensive blue coloration show little to no sales. Via the control window Content you can switch between the displays Sales (Heatmap) and Sales per zip code (Area coloring) by clicking on a radio button. The legends are automatically changed when the analyses are changed.
In the data window on the right you can see three tables. The top table "Territories + Customer Master" contains the individual territories with color, number and name and additional data columns from the middle table "Customer Master".
So you can recreate this map:
- Analysis Heatmap insert, Data column set to "total sales", all other settings remain on default.
- Analysis Surface coloring insert, Data column set to "Total sales" and five Classes with one equally distributed Classification set, then via the menu Classes > Smooth class boundaries, via menu Colors edit a color gradient.
- Color Legend for the heat map and the area coloring.
- Set a Swap visibility group for the two analyses, only one of the two analyses can be made visible in the Contents control window.
- Text box for heading and footnote.
The following tables were used:
- regular clientele
