Map View
After clicking on Finish, easymap creates the structural area structure in the control window Area Organization, as well as territory levels in the map or in the control window Content.
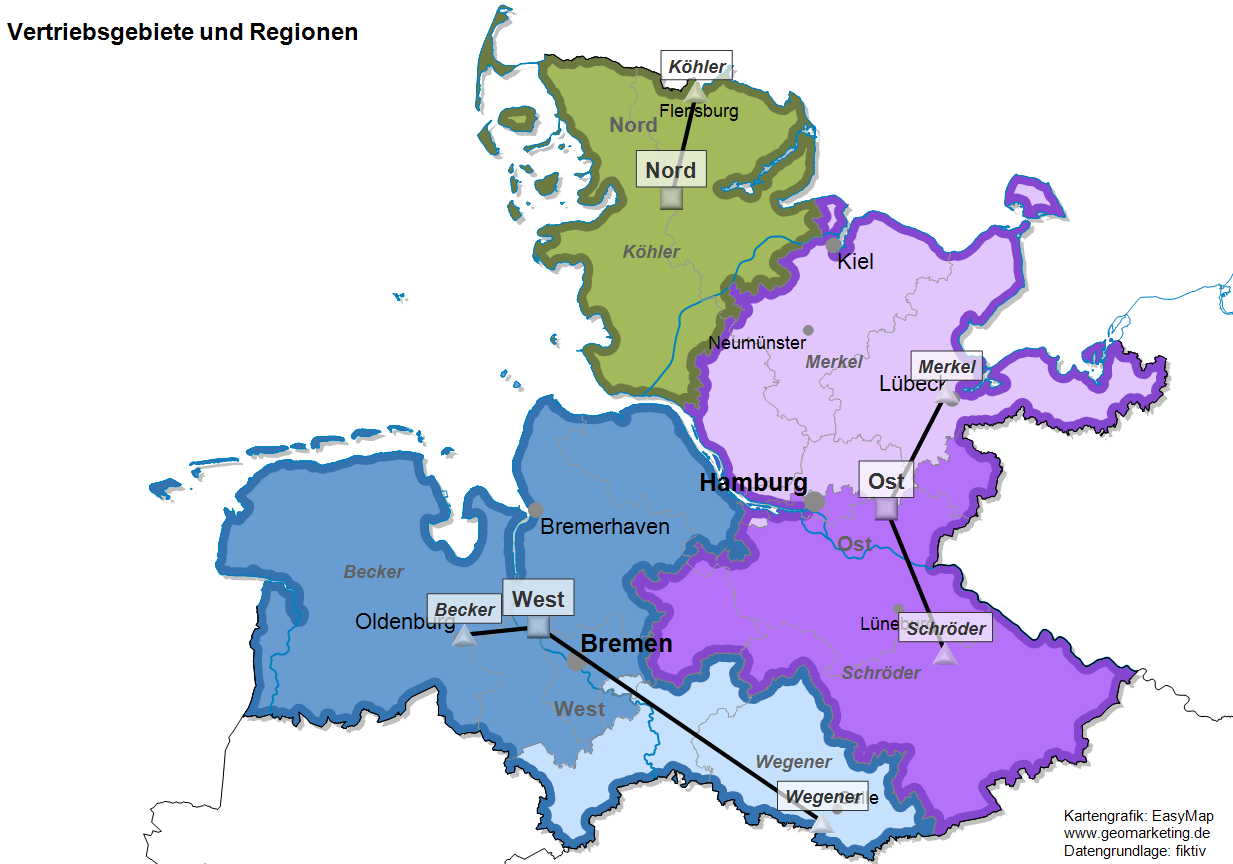
Picture: The finished territory structure with areas (full colors), regions (border colors) and locations to each territory level.
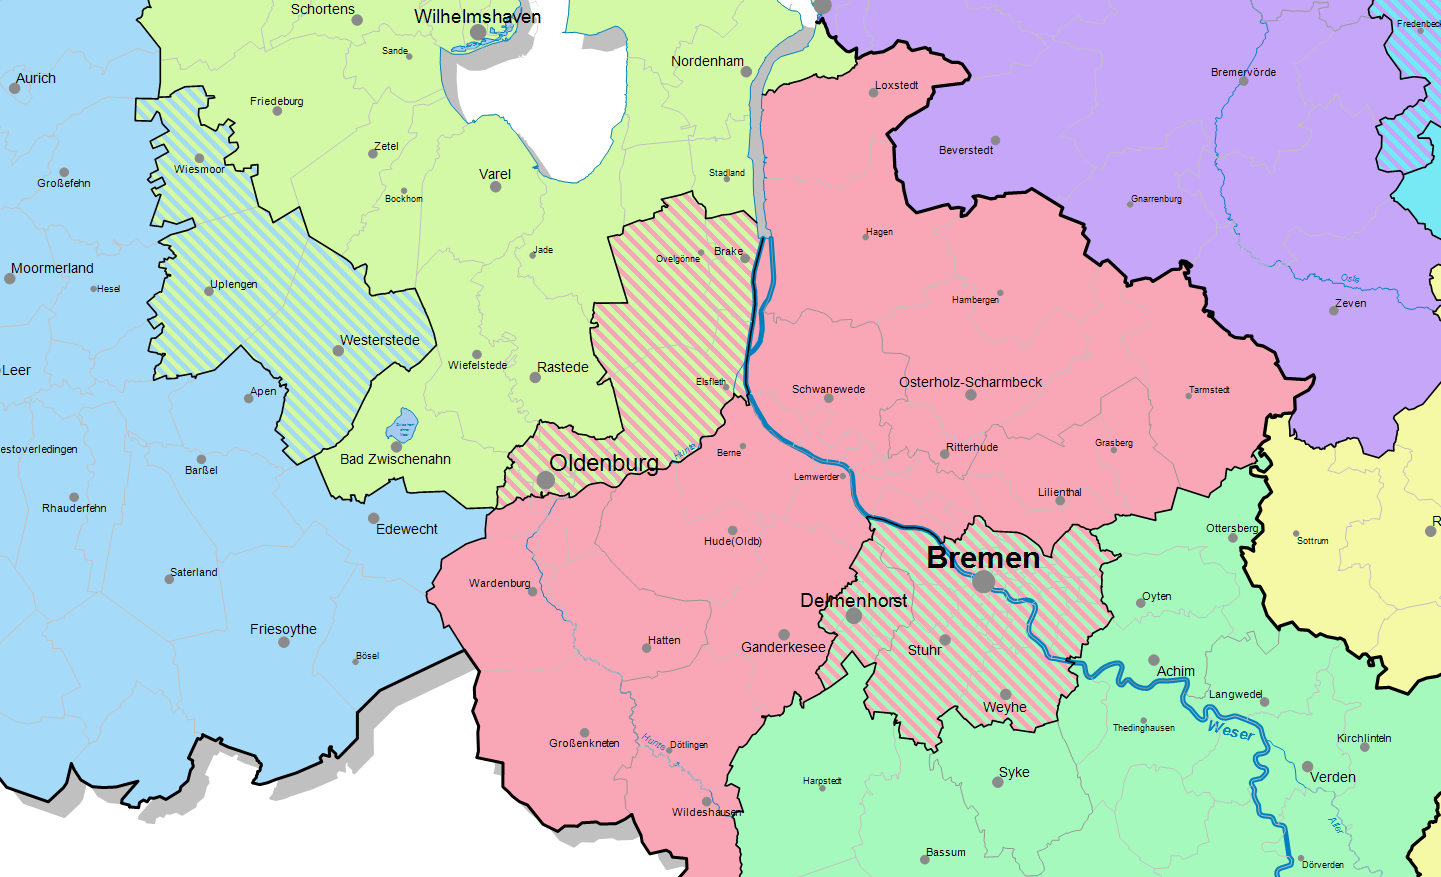
The layers in the content window (properties, locks, point layers)
easymap generates areas, boundaries and labels for each area level. If location levels have also been created, easymap also inserts a display level for each location level in the map and in the control window content.
Moreover, easymap adds a special layer called blocks. This layer is used to mark areas on the map for which blockings have been set up. This layer can also be made visible/invisible and the export properties can be changed. For more details on blocking please refer to the chapter blocking.
All display layers for the territory structure can then be treated like any other map layer, e.g. make visible/invisible, Change display properties, Change order/sequence of characters. Map texts and locations can also be moved on the map using Drag&Drop.
Properties and Commands: The properties and commands can be accessed via the context menu in control window Contents or in the context menu of map window . The properties all refer to the representation of the territory. The colors (for area colors) and names (for texts) are taken from the structural territory levels.
Note: As a convenience, easymap allows you to change numbers, names or colors for individual elements of these levels. However, these properties are not kept in the map layer, but in the structural layer. As a result, the color changes in all map layers based on the same structural layer.
The map view with areas as basic building blocks
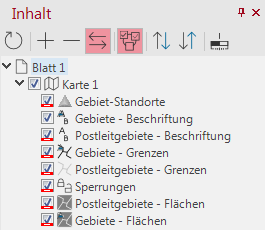
If areas are used as basic building blocks (e.g. postal code areas or municipalities), the territories are also represented as areas. If multiple assignments are used, these are represented by hatching of the relevant territory colors.
For territory structures with several layers, normally only one layer is visible on the map, because the topmost visible area layer covers all the layers below it. In order to be able to recognize the area division of a certain territory layer, only this layer can be made visible and all other area layers invisible. easymap, however, also offers elegant possibilities to make the areas and boundaries of at least two layers visible at the same time.
The figures below show a territorial structure with districts and regions. On the left, the colors are assigned hierarchically; that is, the colors of all districts in a region are based on the color of the region to which the districts belong. The colors of the districts within a region differ only in the hue. This color assignment can be achieved with the command Optimization > Color optimization > Hierarchical in the context menu of the control window Territory organization. In the figure on the right, no full-surface display was selected for the region, but the display Edge color. In this example, this is a display property of the layer Regions - Areas.

The map view with lines as basic building blocks
If a digital map containing lines as basic building blocks (e.g. a road network) is used as a base map, the territories are also displayed as lines. All lines of a territory appear in the color of the territory. Multiple assigned lines are hatched.
The map view with dots as basic building blocks
If a point plane is used as a base map, the points of this plane are represented by symbols. The shape, colour and size of the symbols can be freely selected. How to change the properties of the individual layers is explained here.
To display the territories based on the points, easymap adds the following layers to the map:
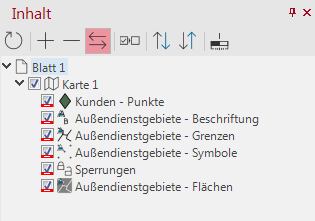
- Territory - Labeling
- Territory - Borders
- Territory - Symbols
- Territory - Areas
With the territory symbols the points are deposited, in order to represent their assignment to territories. If a point is assigned to different territories, the corresponding symbol is hatched (see figure below).

The territory areas are artificial areas calculated by easymap (Thiessen polygons or Voronoi areas). These are invisible by default, but can be made visible by the user and then displayed as full-surface or with border coloring (see figure).
