Vector maps
Vector tiles are a modern map format in which geographical content is provided not as finished images, but as structured vector data. The tiles contain geometries across multiple layers (e.g. roads, buildings, bodies of water) as well as associated attributes, but no fixed visual representation. This means there is a separation between data and visual representation (styling), so that the visual appearance in easymap is generated only through so-called styles.
By separating vector data from the visual display, maps can be customised, loaded efficiently and used interactively. In easymap, vector maps can be customised.
We currently offer vector maps for Germany, Austria, Switzerland and the world. The vector maps are listed in the ‘Map Layers’ control window and are also suggested when inserting a new map layer onto the sheet:
-
In the Map Basics control window , you will find the vector maps in the Background Maps > Vector Maps folder for the respective countries. Vector maps can be inserted onto a sheet in the same way as other maps, using drag and drop.
-
When inserting a new base map, you can add additional topographical content in the dialogue box. The vector maps are also available directly here.
Properties
You can access the properties of the inserted vector maps via the Content control pane. Here you will find all the options for designing and customising the individual elements of the vector map.
The style of the following attributes can be customized in easymap:
-
Colour definitions for areas and lines
-
Line widths and types
-
Show and hide layers
-
Filter rules based on attributes
Note: You can open the context menu for an item selected on the map by right-clicking on it. The context menu and the properties of this item contain, amongst other things, information about its name. This makes it easier to search for a specific item in the list.
Settings
These settings apply to the entire vector map.
| details | Use this setting to choose whether the tiles should be larger (less detail) or smaller (more detail). The more detail that needs to be loaded, the slower the tiles will load. |
| Transparent Color | Set the transparency color for the graphic here. This allows you to place the graphic over other layers without completely covering the layer below it. |
| Geometry types displayed | Here, you can show or hide an entire group. This allows you to visualise individual layers (e.g. labels) on the map and filter out everything else. |
Design
To begin with, a complete list of all map elements is available. Using the search field above, you can search for specific elements and filter the list by the terms of your choice. You can also filter the list by group using the filter icon  . This means that only elements belonging to a specific group or layer – such as ‘Labels’ – will be displayed in the list.
In addition, you can sort the list alphabetically or by character order  or toggle all items in the list to visible or invisible
  .
.
The items in the list can also be shown or hidden by ticking or unticking the box.
To edit the desired item in the list, you must first click on it. Information and attributes relating to this item are displayed below:
| Common | |
| name | Displays the name of the selected item. |
|
Layer |
Indicates which layer (group) the element belongs to. |
| Type | Shows the geometry type of the element. |
| Visibility conditions | |
| Visible | Use this setting to specify whether the element should be visible or hidden on the map. |
| Style |
Here, you can edit properties such as size, colour, shape and type. Depending on which group (labels, lines, areas, etc.) the selected element belongs to, the relevant properties will be available at the bottom. The complexity of some vector data means it cannot be edited quickly, which is why we have introduced the Expert Mode . There, you can edit properties that would otherwise not be possible. |
Expert mode
Attributes that cannot be edited in the design view may be editable in Expert Mode. Clicking Expert Mode expands the view and displays further options.
| Visibility conditions | |
| Filter |
Here you can customise an advanced filter for the selected item. |
| Max. Zoomlevel |
Select the maximum zoom level at which this feature should be visible on the map. |
|
Min. zoom level |
Select the maximum zoom level at which this feature should be visible on the map. |
Note: The maximum and minimum zoom levels only affect the zoom level at which the element is displayed. This means that if an element (e.g. ‘Country name’) is, by definition, only displayed between zoom levels 22 and 20, it cannot be displayed at other zoom levels.
It is only possible to edit the predefined zoom level. In this example, we could specify that the ‘country name’ element is only displayed between zoom levels 20 and 21.
| Definition of style | |
| Json |
Define the entire style for a specific element yourself in JSON format. |
Theory explained using an example
The advantage of separating the layers is that they can be used as individual elements, for example to display specific points of interest on the map.
Let’s assume we want to display only the wind turbines on the map. To do this, we proceed as follows:
-
In the properties, we hide all other layers of the vector map and leave only the wind turbine symbols visible.
-
First, we move the vector map layer to the top in the Content panel. This ensures that the wind turbine symbols are displayed over the areas and lines.
This principle can be applied an infinite number of times to create several separate layers from the vector map.
Save styles
Customised styles can be saved for use in other easymap projects. A style typically includes:
-
Layer configurations
-
Colour and symbol definitions
-
Display Rules and Filters
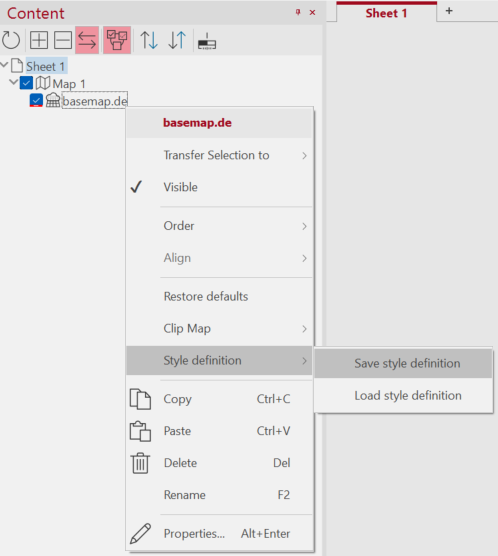
To save your own style definition, right-click on the edited layer of the vector map in the control pane. Then, from the context menu, select Save style definition and choose the folder in which you wish to save the file. The style is saved in JSON format.
Commands
Saved styles can be reloaded at any time and applied to other map folders. This allows you to switch quickly between different display options.
To load your own style definition, right-click on the vector map layer in the control window. Then select Load style definition from the context menu and browse your computer for the style definition you have saved.
Technical Operation
Data retrieval
The vector tiles are loaded directly from external providers (see the copyright notices in the application). Mapbox Vector Tile is typically used as the data format.
Initial loading and temporary storage
The first time a map section is accessed, the required tiles are downloaded from the internet and stored locally in the cache. This enables faster loading times on subsequent accesses and reduces data usage. An internet connection is therefore required to use the vector tiles, particularly for the initial download of the data and subsequent updates.
Each vector tile is displayed using a predefined default style, which can be changed later.
