User-defined area labeling
In this exercise we deal with the possibilities of labeling areas on a map. The task is to give the territories a name and to display the turnover data of the individual territories on the map.
With all digital maps supplied, you can easily label the areas with the respective name and/or number of the area (e.g. postcode or municipality code). Furthermore, other area-related data can also be included in the map as inscriptions!
For this example we have inserted the base map of the postal code regions on the sheet. In addition, a "Customer Master" table with sales data for the 2-digit postal code regions has already been imported into EasyMap.
The area designation on the map is currently limited to the 2-digit postal code region number. Instead of this number, an individual label is to be displayed.
To do this, proceed as follows:
- In the control window Content double-click with the left mouse button on the layer "Postcode regions - Labeling".
- Select the area area text.
- Open the drop-down list of Text Macros > Area Properties and select Name.
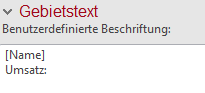
Under Custom Labeling should now read "[Name][Default Labeling]".
- Now delete the text part "[Standard labeling]", so that only "[Name]" is left in the text field.
Only the name of each area is now displayed. You will notice that the lettering partly overlaps with the city points (e.g. Hamburg-Süd with Buchholz). The different ways to reposition texts are described in Step 4.
In addition to labeling areas with numbers and names, you can also include your own data in the labeling. As an example, the labeling of the territories is now to be supplemented by sales data. The "Customer Master" table required for this has already been imported. How to import data is explained in the tutorial Import data.
To display the sales figures as area text, proceed as follows:
- In the control window Content double-click with the left mouse button on the layer "Postcode regions - Labeling".
- Open the area area text.
- Insert a new line in the text editing field behind "[Name]" and write "Turnover: " there.
- You will notice that the word "Turnover: " has been immediately added to the inscription on the map.
Now only the concrete turnover data per region are missing. To do this, please proceed as follows:
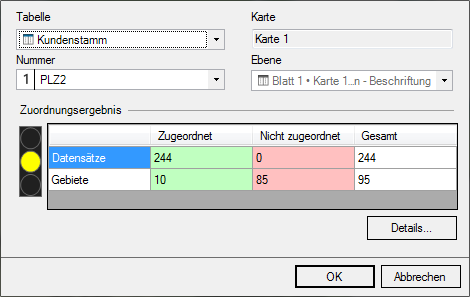
- First click on Data Source Table, then click on the button with the three dots and select the external table Customer Base in the newly opened window. Make sure that for Number the column with the correct area number is selected; in this case the column with the 2-digit postal codes, since we work at the level of the postal code regions.
- Confirm this procedure with OK.
- Then select under Text macros > Table columns the column "Total sales" > Total.
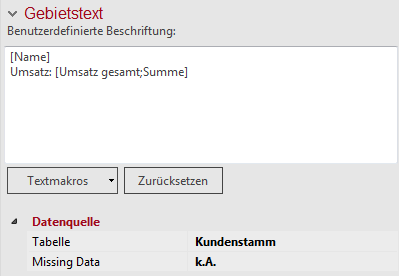
The user-defined label should now look like the one on the right.
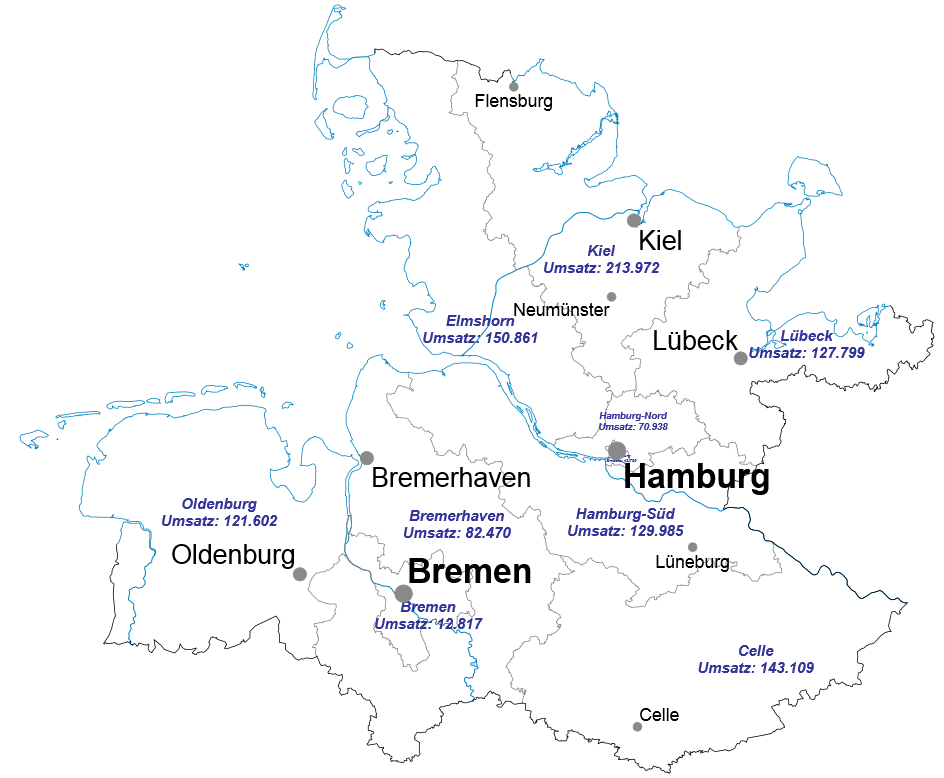
The map now shows the sales per postal code region. You will notice that the map has become very confusing due to the additional labels, so in the next step you will see how the texts can be better placed in the map.
There are many ways to make the position of the texts on the map clearer. One of them is to make the text a little smaller.
Customize font
- In the control window Content double click with the left mouse button on the layer "Postcode regions - Labels".
- Select the area Labelling.
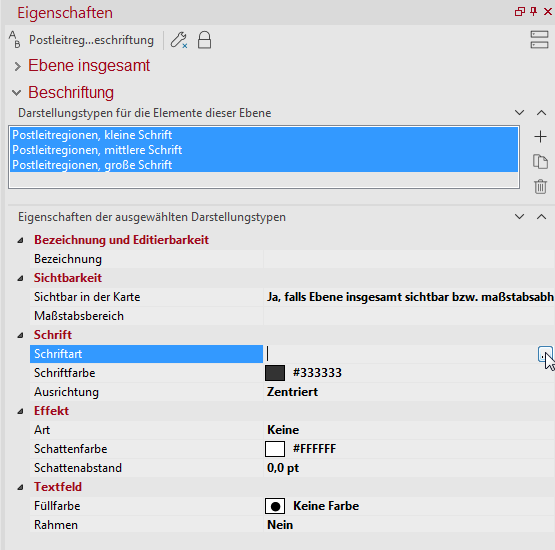
- Select all three display types of the postal code regions by holding down the Ctrl key.
- Click in the menu Font on the submenu Font.
- A button with three dots appears at the right edge of the line.
- Click on this button and select the Shrink font button several times in the new window.
- Confirm your change in both windows with OK.
The caption in the map should now be smaller and some text overlaps should disappear.
Moving texts in the map
Another possibility is to move the text manually. Try this out using the example of Oldenburg. And so geht´s:
- Mark the text "Oldenburg" in the map by clicking with the left mouse button.
The marking is represented by a hatched frame around the text. If you now move the mouse pointer over the marked area, the mouse pointer becomes a cross with arrows in all four directions.
- Now move the text to the desired position by holding down the left mouse button.
Changing label positions
Another way to minimize text overlap is to position the city name differently to the city point. In this exercise it makes sense to arrange the name of the city of Hamburg differently. The following steps are necessary:
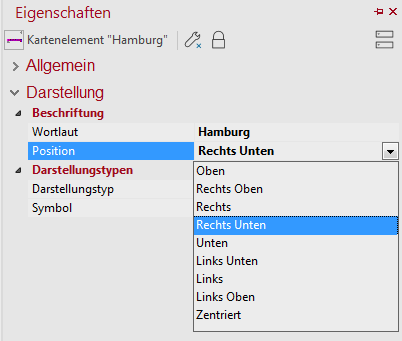
- Double click with the left mouse button in the map on "Hamburg" to open the properties of the map element.
- Select the area Display.
- Select Labelling for the submenu Position = Right Down.
The city name "Hamburg" should now appear in relation to the city point at the bottom right. Just try to adjust the overlapping labels in this way.
If you have followed the instructions of this exercise, your map should look something like this:
Note: As an alternative for writing user-defined texts in area areas, a text analysis must be created. The procedure is similar. To use data from external sources, you always need a column with the area number.
