raster map
easymap offers you the possibility to create graphics provided with coordinate information (format GeoTiff), to be placed exactly in position under an existing map.
easymap includes a few raster maps in the standard scope of digital maps - one elevation relief each for Germany, Europe and the world as well as a shaded map for Germany and Europe. After installing the base maps, you will find them in the control window base maps in the folder raster maps (GeoTiff).
Insert raster map
You can insert raster maps like the other maps by dragging and dropping them onto a sheet, the only requirement is that a base map (e.g. postcode areas) has already been inserted on the map. Custom raster maps can also be inserted via the control window Objects > Geography > Raster map/image onto an existing map via drag&drop.
Note: If there is no coordinate information contained in the graphic, an error message will appear and the graphic may not be positioned accurately.
Properties
The properties of the raster map can be accessed via the control window Content. Here you can, for example, embed the graphic in the workbook or set a transparency color for the background of the graphic.
The following setting options are available:
| Caption and Editability | |
| Caption |
Specify a name here to be able to find the element more quickly in the Contents control window. For analyses, maps or sheets, you should use a name that contains the topic. EasyMap assigns generic names for new elements (e.g. map 1). If you do not change these, you will later have great difficulty in finding certain content in workbookn. |
| Visibility | |
| General |
Here you can control the visibility of objects and elements. |
| Scale range | |
| Alternating visibility group |
Set a group for mutual visibility here. If the element is to be made equally visible with other elements, you must use the same name for the visibility group. |
| Simultaneous visibility group |
Set a group for simultaneous visibility here. If the element is to be made mutually visible with other elements, you must use the same name for the visibility group. |
| Location | |
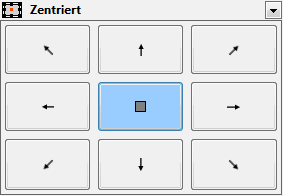
| Anchor point |
Select the point from which the size of the element is to be calculated.
|
| Offset Left |
In conjunction with the reference point, the distance in cm from the left. |
| Offset from Top |
In conjunction with the reference point, the distance in cm from the top. |
| Size | |
| Width |
Width of the object in cm. |
| Height |
Height of the object in cm. |
| Style | |
| Fill | |
| Border Color |
Specifies the color in which the frame around an object is to be drawn. You can specify the color using the color selection field or directly as HTML color value. If no color is specified, no frame is displayed. |
| Border Width |
If a frame is displayed around the object, the width of this frame can be set here. |
| Shadow | |
| Shadow Color |
Specifies the color in which a shadow representation of the object is to be drawn. You can specify the color using the color selection field or directly as HTML color value. If no color is specified, no shadow is displayed. |
|
Shadow Spacing |
If a shadow is displayed to the object, the distance or width of this shadow can be set here. |
| Source | ||
| Image File |
Shows which graphic file is used or loads a new graphic file. (Please also note comments on embed graphics) A change of the graphic file is also possible here. To do this, click on the button with the three dots that appear when you click in the field with the path. |
|
| Embed Image |
Yes (default): The graphic is loaded from the specified file, but then saved as a copy in EasyMap. If the graphic file changes afterwards, this no longer has any effect on the display in EasyMap. When the workbook is passed on, the graphic is always present. Large graphics increase the size of the workbook accordingly. No: The graphic is reloaded from the source each time so it also takes over the updated content. It does not contribute to the enlargement of the workbook. However, it must be ensured that the graphic file is accessible on every computer, otherwise the graphic will be displayed with a red (x). In this case, it can be reloaded by specifying the correct path under Graphic file. This option should be selected for large graphics. |
|
| Color | ||
| Transparent Color |
Here you can set the transparency color for the graphic. This allows you to place the graphic over other layers and not completely cover the underlying layer. Example: If the geotiff file has a white background, set the transparency effect to white as well (#FFFFFF), now only the actual contents of the geotiff are displayed and the layers underneath shine through. |
|
| Coordinates | ||
| Coordinate System | The GeoTiff coordinate system information is displayed here. | |
| Projection mode | Here you can set whether the tiles should be rotated or distorted. With rotated tiles you increase the sharpness of the display, but there may be gaps between the tiles. The blurred display prevents gaps between the tiles. | |


