
Search for customers within a radius
Please also take a look at our video tutorial on how to search for customers within a radius.
In this exercise we will show you how to determine points (e.g. customers) that lie within a certain radius around points on another level (e.g. sellers). For this purpose we will use functions of the symbol and radius analysis and create a query in order to record the results clearly in tabular form. The procedure is available in both the EasyMap DistrictManager Edition and the Standard Edition.
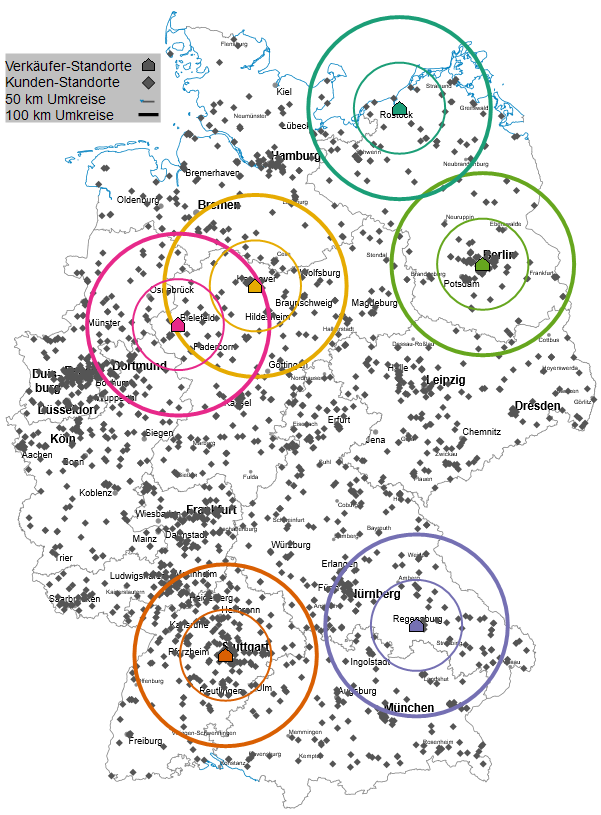
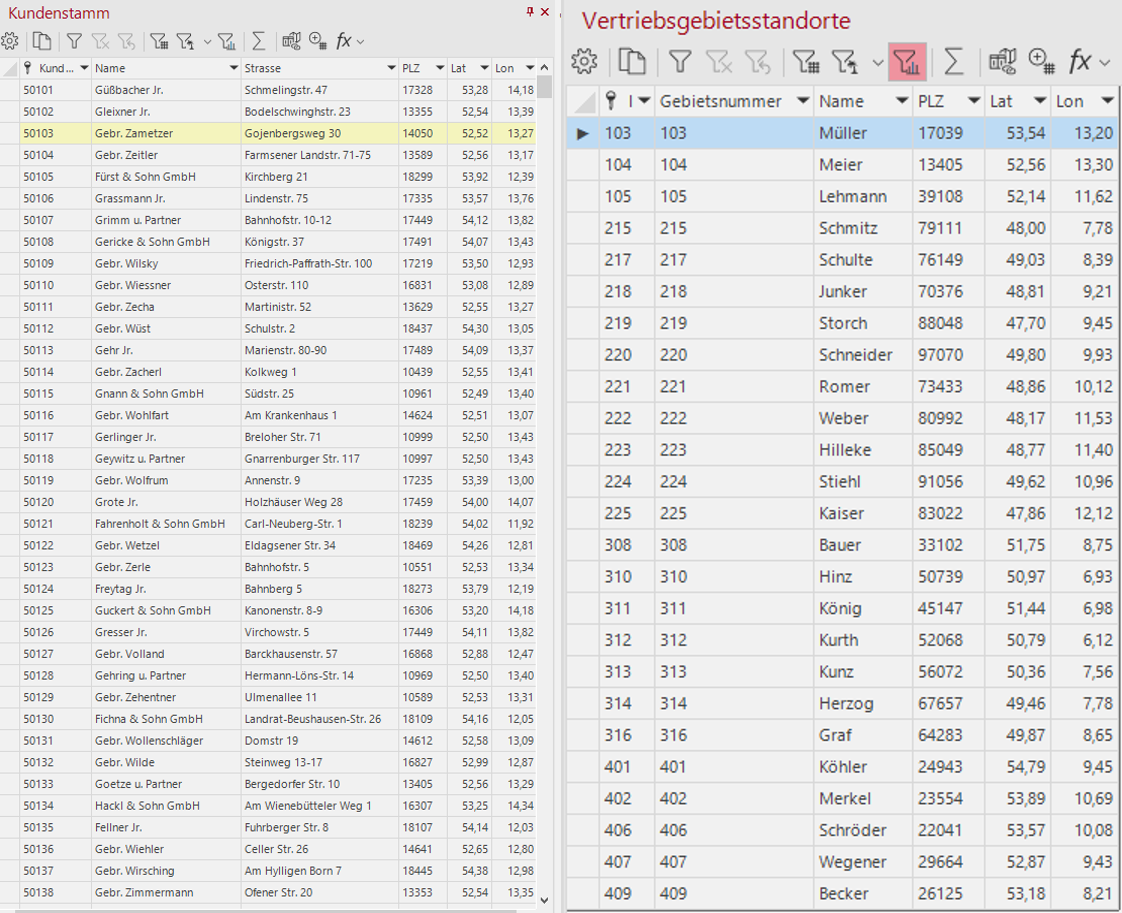
Customer and seller data including their location data are required for this map. For the analysis within a radius, a position determination via geographical coordinates provides the most accurate results. An assignment via territorial units, e.g. postal codes, is also possible. In the following example, coordinates are used as a basis (see Fig. 2).
Please make sure that a primary key is assigned during the import of your data, because the Located in... - function requires a unique assignment for each data entry.
If you are unsure how to import your data, click here.
After you have inserted the appropriate base map, create your customer and seller locations. To do this, perform a symbol analysis for both data sets.

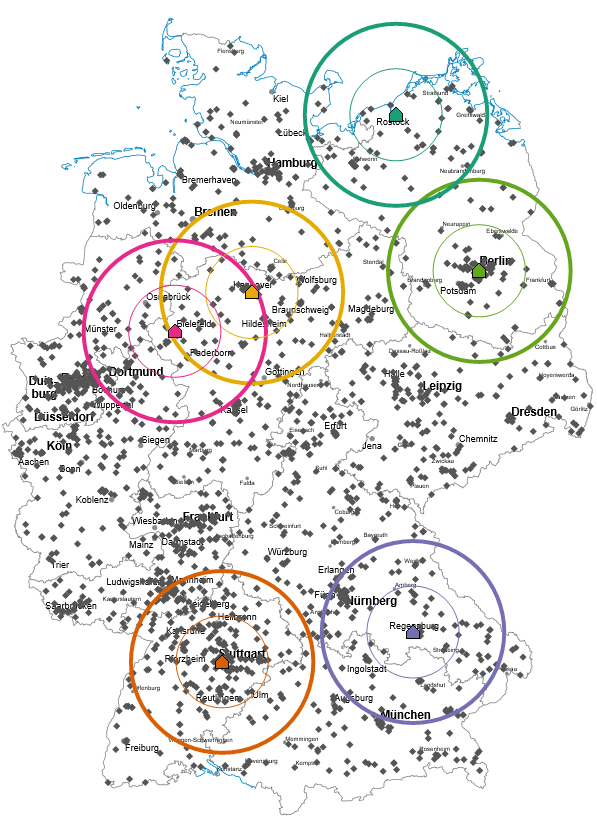
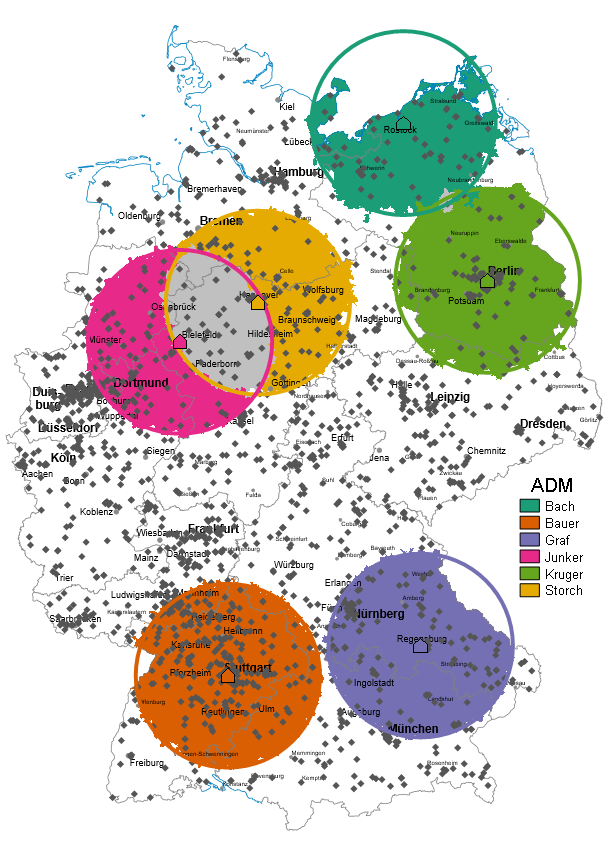
Now circles around the the seller locations are to be created to which the customers can later be assigned. Perform a circle analysis. If you want to record your data in several circles, simply repeat the circle analysis and adjust the radius accordingly. It can be useful for further processing to extend the names of the circle analyses in the contents control window by the specified radius so that you can keep track later.
If you have coordinates as well as postal codes for your seller locations, make sure that you use the same value for locations and circles otherwise deviations will occur.
The assignment of the customers in the radius of the sellers can now be displayed in the table.
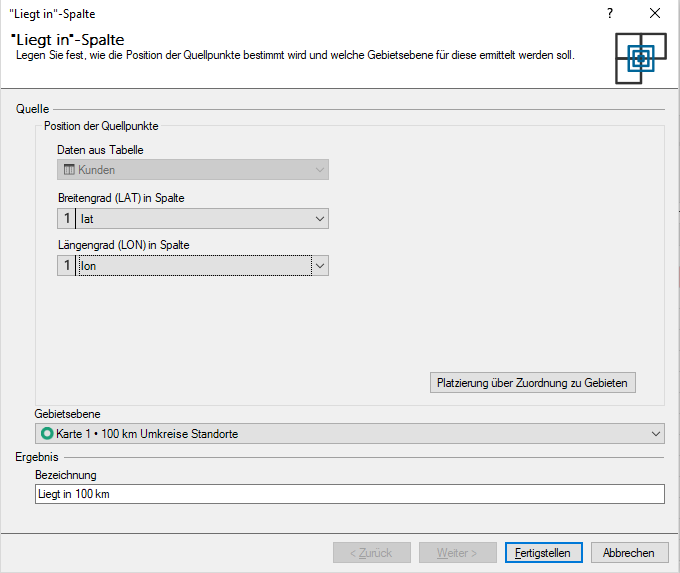
To do this, click on the fx button in the toolbar of your customer table and select the Located in function.
In the dialog window you can then select your previously created circles under area level and click on finish.
A new column is then added to your customer table, which lists the radius to which a customer has been assigned. As you can see, the radii may overlap. This leads to multiple assignments in the table query.
To view this overlap set separately, you can filter it out. To do this, click in Table window on the title of the newly calculated column and leave only #ambiguous selected. You can also use the same procedure if you only want to display certain perimeters.
Number of customers in seller radii
If you want to know the number of customers in the sales radii first call up the table with the sellers locations. Then start by clicking the fx-Button in the Toolbarof the Table Window on and select the function Count of elements in.... In the dialog box, note that Source is the symbol analysis of your customer locations, and Area Level is the symbol analysis of your perimeters.
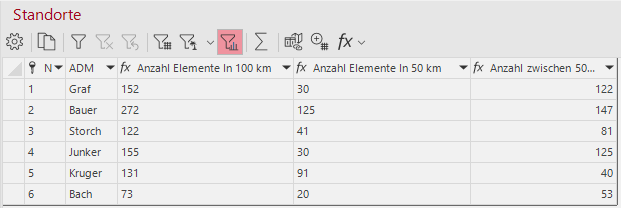
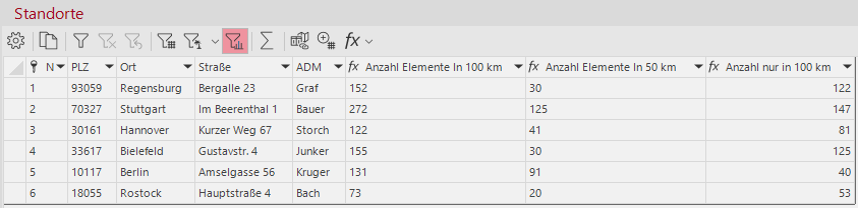
If you then click on Finish you will get a column in your seller location table showing the number of customers per circle.
If you have created several perimeters, you must note that the larger perimeters also include the customers in the smaller perimeters.
To display the additional number of customers in the outer radius in your tables, you must calculate a new column. Click the fx-Button and select Calculated column.... Enter the following calculation in the formula window:
cval([Number of elements In 100 km]) - cval([Number of elements In 50 km])
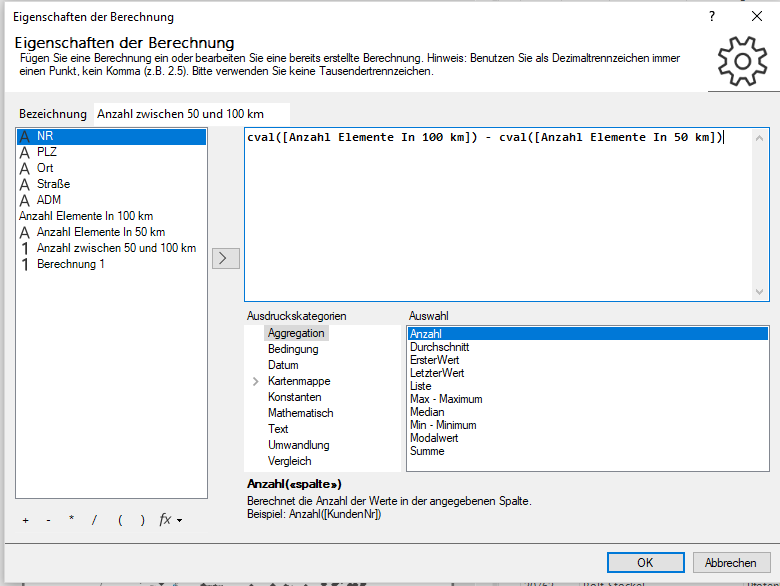
You will then receive a column containing only those customers who are between 50 and 100 km away from the seller.
If you want to know which postal code areas (or municipalities, RPI cells or segments) are in your circles, you can do this with a query.
To do this, click on Data > New query... in the main menu. Then add the area table of your postal code areas under Geographic data and close the selection window.
In your query, double-click on the column Number of the area table. Then click on Add column > Located in... . In the window for the Located in..-Calculation select your circles for the Area Layer and click Finish. If you then click Ok, your query will be executed and a table with the results will open on the right side. Via the Located in column you can now filter by individual circles to display the postcode areas for each circle.
If you want to highlight the result in color, you can perform a area shading for your query.
Click on Analyses > Area shading... and select your query at Data from table and finish your analysis.
In the properties of the analysis, make sure that the data column Located in column is selected and that the Classes > Classification Atribute is selected.
A faster (ad-hoc) analysis of customers in the vicinity of locations can also be carried out by means of selections.
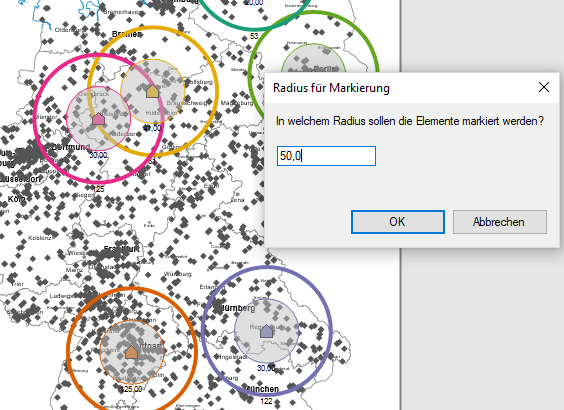
If customer and seller locations are drawn as symbols on the map, you can mark all points of a plane within a certain radius using the mark button Radius in the toolbar.
To select the points of the correct layer, it is recommended to select the appropriate Selection layer and fix it by clicking on the button with the lock symbol.
If you have selected the selection mode Radius, click with the left mouse button on a sales location on the map. A dialog box opens in which you can specify the radius (in km) for the selection.
Now all customers are marked in the radius of this seller in the map as well as in the customer table. Click the Filter by selection button in the customer table. With this button you can copy the filtered table to the clipboard and import it again as a new table.
