
Advanced Settings - Define Contents
In this settings window, you determine which contents of your map should be available in EasyMap Xplorer. For example, you can configure the initial Default view when calling the workbook or select a Background map.
Note: Please note that some of the settings only apply to the EasyMap Xplorer and others are also applied directly to EasyMap. The settings which are taken over in the workbook are marked separately. The changes that are applied to the workbook are marked with ¹.
Structure of the Settings Window
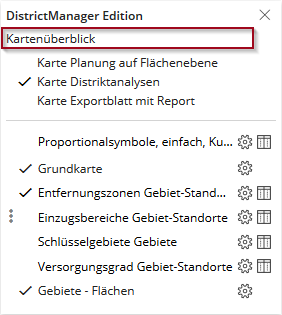
In linken part of the settings window you can see the contents of the EasyMap-workbook, structured and summarized corresponding to the view in the EasyMap Xplorer. The map levels are marked differently depending on availability:

|
layer is available in EasyMap Xplorer and is already visible when opening the map. |

|
Layer is available in EasyMap Xplorer, initially invisible when opened, but can be made visible in EasyMap Xplorer. |

|
Layers is not available in EasyMap Xplorer. If the font for these layers is displayed in gray, you cannot change the availability (e.g. PTV maps or for area layers without colored areas). |

|
If a layer has further sub-elements or if, for example, the base map has been combined to form a layer, there is an arrow pointing to the right in front of it which lists the sub-elements by expanding it. If legends have been inserted for an analysis, the Legend sub-element is listed. |
After selecting an element, you can adjust various settings for display, label or filter on the right page of the window.

You can use the toolbar to control the following actions:

|
Expand the view. |

|
Reduce the view. |

|
Move one layer up. |

|
Move one layer down. |
Commands in the context menu
In the table of contents on the left, you can call context menu commands on individual levels.
Changing the order of maps and layers
For single layers and maps you can change the display order with the commands Layer down and Layer up or also add a layer to the base map. If the layer is added to the base map, it can no longer be made visible or invisible separately in the Xplorer. Layers below the base map can be removed from this group with the context menu command remove from base map and can be used as a separate layer in the content of the map, with all setting options like other layers.
Transfer settings
Would you like to transfer individual settings directly to several analyses or to all maps?
On the right side, you can apply the settings made for individual properties to other layers via the context menu command Transfer to....Select the appropriate setting, e.g. available = Yes, and then click Transfer. Another window opens, in which you can select the layers to which you want to transfer the setting.
The settings of the different map layers
| Caption |
Enter the desired name for the area heading Maps in the window Content. |
| Default view |
If you have several sheets and maps, you can specify here which map is to be displayed first (open). |
| Control windows |
Here you have various options for selecting the EasyMap Xplorer control window. The first time you call up the map, the selected window is displayed open, or you can prevent a window from opening or make the menu completely invisible. Choose here between:
|
| Local path |
Shows you where in which directory the workbook was saved. |
| Common | |
| ¹ Caption | Here you can change the name of the map. The name of the map can be found in the EasyMap Xplorer under the workbookntitel as well as in the content control window, if several maps are available in the folder. |
| Available |
Select here whether the selected element should be available in the Xplorer. |
| Infinite world | Infinite World = Yes means that the map always repeats itself when moved, similar to a globe. |
| ¹ Background color |
Select a background color for the map here. Please note that this colour will also appear in your workbook immediately after your choice. |
| copyright |
Enter the copyright information for your map here. In addition to your entry, the following copyright appears: © Lutum+Tappert DV-Beratung GmbH 2018 If a background map such as Bing Maps is inserted, the copyright notice of the background map also appears. |
| Map title | |
| Style |
You have four options for displaying the map title:
|
| logo |
In addition to the map title, you can optionally select a logo to display it in the EasyMap Xplorer. |
| Text color / Background color / Opacity in % | Define individual font color, background color and opacity for the entire map title field. A set transparency makes sense in order not to completely cover the underlying map contents. |
| Settings | |
| Layers movable | Set here for the respective map whether the map layers in the content can be moved in their drawing order by drag&drop. |
| Zoom level | |
| Visible from / to zoom level |
Here you can set the zoom level, from and to where the map is visible. This allows you to prevent zooming too far into or out of the map. The zoom levels are fixed levels from 0 - 19, based on the widely used Internet map services in WebMercator projection. |
| Caption | Enter the desired name for the group in the Xplorer here or enter nothing if the content area is not to have a heading. |
| Common | |
| ¹ Caption |
Enter the desired name here. Please note that the name you enter here also appears in the workbook. |
| Available |
Select here whether the selected element should be available in the Xplorer. |
| Visible | Select here whether the selected analysis should be visible in Xplorer. |
| Visible in the control window | Here you can specify whether this analysis is visible in the table of contents, regardless of the visibility in the map. Note that this layer cannot then be made invisible in the map. |
| Scale range | Here you can find out whether a scale range has been set up in EasyMap for the analysis. According to this setting, the analysis is also displayed in the Xplorer. This setting can only be changed in EasyMap. |
| ¹ Mutual visibility group | Enter a group name for the levels that are to be displayed alternately. Existing visibility groups from the EasyMap workbook are taken over. |
| ¹ Same visibility group | Enter a group name for the layers that are to be made visible and invisible at the same time. Existing visibility groups from the EasyMap workbook are taken over. |
| Settings | |
| Opacity adjustable |
Here you can define whether the transparency of the map layer or analysis may be changed and whether an output opacity in percent may be preset, e.g. to let a background map shine through. |
| Opacity (%) |
Set the opacity value in percent here. |
| ¹ Caption |
Enter the desired name here. Please note that the name you enter here also appears in the workbook. |
| Available |
Select here whether the selected element should be available in the Xplorer. |
| Display | Here you can set whether the legend should be displayed in the control window Legenden or below the control window . |
| Show header | Select whether the legend level name is to be displayed. |
| Text color / Background color / Opacity in % | Here you can define individual font color, background color and opacity for the legend element. A set transparency / opacity makes sense in order not to completely cover the underlying map contents. |
| ¹ Caption | Enter the desired name for the basic map group here. |
| Available |
Select here whether the selected element should be available in the Xplorer. |
| Visible | Here you can set whether the base map - with all available sub-elements - should also be visible. |
| Visible in the control window | Here you can specify whether the base map is visible in the table of contents, regardless of the visibility in the map. Note that this layer cannot then be made invisible in the map. |
| Opacity adjustable |
Here you can define whether the transparency of the map layer or analysis may be changed and whether an output opacity in percent may be preset, e.g. to let a background map shine through. |
| Opacity (%) |
Set the opacity value in percent here. |
| ¹ Caption |
Enter the desired name here. Please note that the name you enter here also appears in the workbook. |
| Available |
Select here whether the selected element should be available in the Xplorer. |
| Visible | The sub-elements of the basic map cannot be switched to visible or invisible separately. This setting can only be changed in EasyMap. |
| Scale range |
Here you can find out whether a scale range has been set up for the element in EasyMap. According to this setting, the element is also displayed in the Xplorer. This setting can only be changed in EasyMap. |
| Caption | |
| Street Map | Here you can select a road map for display in the Xplorer. If a map is selected, the following setting options are available. |
| Initial map style |
Select the map style to be displayed in the Xplorer the first time the map is opened. You can choose between the following settings:
|
| Visible in the control window | Here you can specify whether the base map is visible in the table of contents, regardless of the visibility in the map. Note that this layer cannot then be made invisible in the map. |
| Search | |
| Search | Here you can set whether the background map can also be used when searching. |
| Search result shows | |
| Zoom level | |
| Visible from zoomlevel | Select the zoom level from which the background map should be visible in the Xplorer. |
| Visible to zoomlevel | Select the zoom level up to which the background map should be visible in the Xplorer. |
| ¹ Caption |
Enter the desired name here. Please note that the name you enter here also appears in the workbook. |
| Controlling Layer | Displays the controlling level of the area report. This specification cannot be changed. |
| Available |
Select here whether the selected element should be available in the Xplorer. |
| Permission set | Select the authorization set that controls access to the report. If no access rules have yet been created, you can create a new authorization set here. With (no access restriction) anyone can view the report pages. |
| Permissions | Gives you the possibility to adjust the permissions for the registered users. If you click on , you will be forwarded directly to your Xplorer profile, where you can control Report access and make necessary changes. |
Data display on the map and in tables
In EasyMap Xplorer, you can display data on territory levels using context-sensitive tooltips in the maps. In analysis outputs and area layers, you can define exactly what should be displayed when you click on a location on the map. In addition, you have the option of displaying tables for each analysis or area level below the map, as well as allowing the export of the data.
To configure the table and data displays, first select the desired level in the left area of the settings window.
| Selected table |
You can only select tables for levels from the territory structure - here you can choose between geographic tables and territory work tables. |
| ¹ Table | Here you can rename the name of the table used for the analysis or surface plane. |
| Column settings |
After clicking on Edit column settings... you can make various settings regarding display, search and filter options for analyses and territory structures. The data columns of the table on which the selected analysis is based are displayed. Columns can be renamed for display in the EasyMap Xplorer or by setting or removing check marks, the display, search and filter options can be restricted to individual columns. You can also insert separator lines and dividing lines for a clearer display of the data. You can select multiple rows by holding down Ctrl to change their settings at the same time, e.g. to set or remove checkmarks or to change the order of the columns. |
| Allow table display | Here you set whether the table can be displayed in the Xplorer. |
| Allow table export | Here you set whether the export of data in Xplorer is allowed. |
|
Data display
|
Here you can set whether and with which user interaction the data should be displayed in the Xplorer. You can suppress the data display with the None option, or display on click first, or directly on mouse over, i.e. when hovering over the map with the mouse. The behavior when clicking in the area can still be varied: click (highlighted) changes the mouse pointer to a hand symbol to emphasize that a data display is possible at this point. With click (opens link) a link defined by you will be opened. The prerequisite for this option is that there is a Href column and a Target column in the table base. These columns must be selected here. |
| ¹ Allow search |
Here you can set whether the search is allowed within the analysis or the surface plane in the Xplorer. The search option Address is only available if you activate the Bing Maps street map as background map. You can book a Microsoft Bing Maps license when ordering the EasyMap Xplorer. |
| Search shows |
With the Search result option, only the result in the data window that is also clicked in the search results is displayed in the map. The Data Display at Position option simulates the Data Display at Clickon the map. If you click here on a specific search result, the data window in the map shows not only the clicked result, but also the objects that are in the immediate vicinity. You can then switch between the entries in the lower area of the data window. 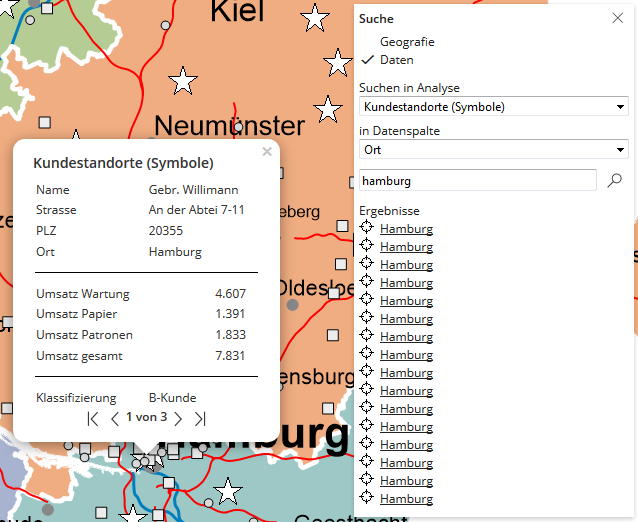
Example Data display at position: When searching for data in a customer table, you enter "Bonn" as the search term. In the search result all customers are listed, where "Bonn" is available in the selected column. If you now click on a search result, the map will show you further customers in the opened data window. These are all located in the immediate vicinity of the selected customer. |
| ¹ Allow filter | Here you set whether filtering is allowed within the analysis in Xplorer. |
| Filter mode |
Extended - in this mode you can use the functions Remove filter from map, Apply filter to map and Restore map filter in the table view - switching to the simple filter mode is possible in EasyMap Xplorer. Single - in simple mode, filters in the table are applied directly to the corresponding analyses in the map view - switching to extended filter mode is possible in EasyMap Xplorer. Easy forced - it is not possible to switch from the simple filter mode to the extended mode. |
